PSYCH 1X03 Chapter Notes - Chapter 2: Summary Statistics, Descriptive Statistics, Statistical Hypothesis Testing

6 Nov 2016
School
Department
Course
Professor
Document Summary
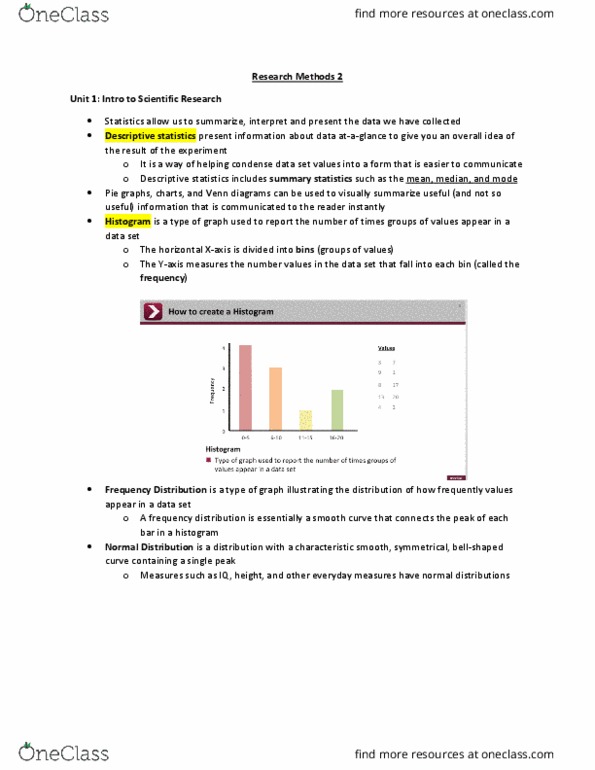
Present information about data at-a-glance so that you can understand the overall idea of the experiment. Includes summary statistics such as mean, median and mode. Histogram type of graph used to report the number of times groups of values appear in a data set. X axis is divided into groups of values called (cid:862)(cid:271)i(cid:374)s(cid:863) Y a(cid:454)is is (cid:373)easu(cid:396)es the (cid:374)u(cid:373)(cid:271)e(cid:396) (cid:448)alues i(cid:374) a data set that fall i(cid:374)to a gi(cid:448)e(cid:374) (cid:271)i(cid:374), k(cid:374)o(cid:449)(cid:374) as the (cid:862)f(cid:396)e(cid:395)ue(cid:374)(cid:272)(cid:455)(cid:863) Frequency distribution a type of graph illustrating the distribution of how frequently values appear in the data set. A smooth curve that connects the peak of each bar in the histogram. A distribution with a characteristic smooth, bell-shaped, and symmetrical curve containing a single peak. Mean the average value in a data set. Outliers extreme points, distant from others in a data set. Mode the value that appears most frequently in a set; most typical response; can be used for non-numerical sets as well.