STAT 101 Chapter Notes - Chapter 1: Bar Chart, Pie Chart, Categorical Variable

6 Apr 2016
School
Department
Course
Professor
Document Summary
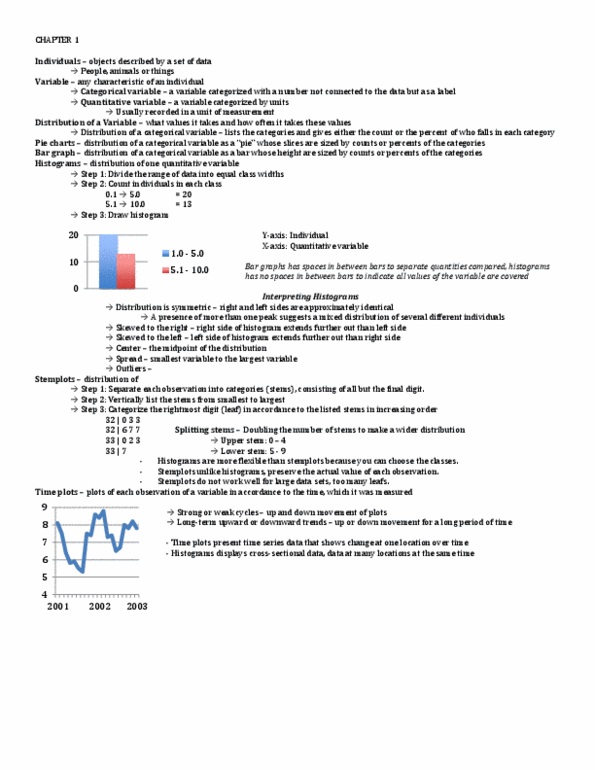
Individuals: objects described by a set of data. Categorical variable: just a label: quanitaive variable : takes numerical values for which arithmeic operaions e. g adding and averaging. Histogram ( its not unique easy changeable appearance ): 1. Choose classes of equal width horizontal axis 2. Labelling of x-axis is word or category with space. Interpreing histogram: histogram( best for large data sets) Overall patern and for striking deviaion from that patern. Describe the overall patern by its shape, center and variability. Also can see variability refer to as spread. An important kind of deviation is an outlier, an individual value that falls outside the overall pattern. Bell-shaped quite symmetrical and central peak. Right stewed (tail it"s on the right) long tail on right, peak towards let. Let stewed (tail it"s on the let) long tail on let, peak towards right. Flat or uniform quite symmetrical with no obvious peaks or valleys.