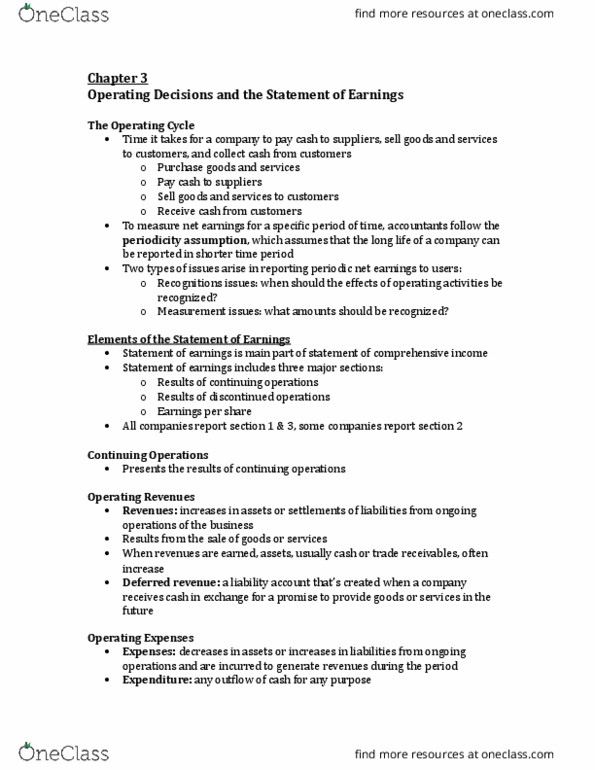
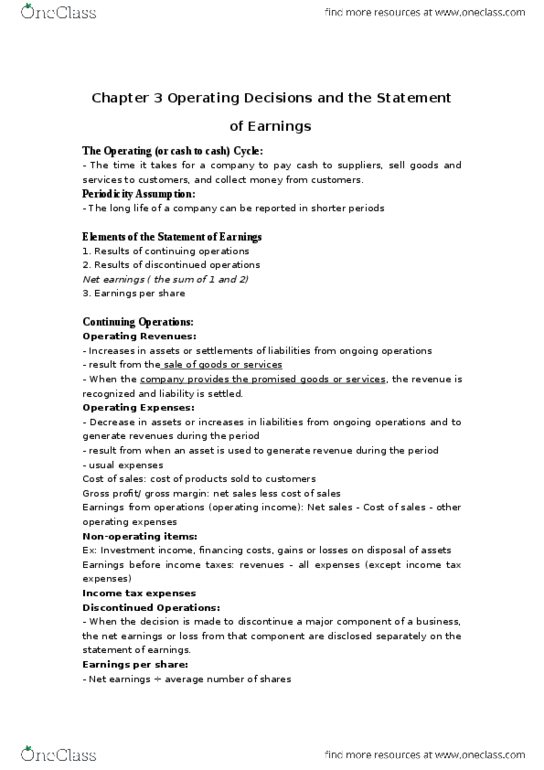
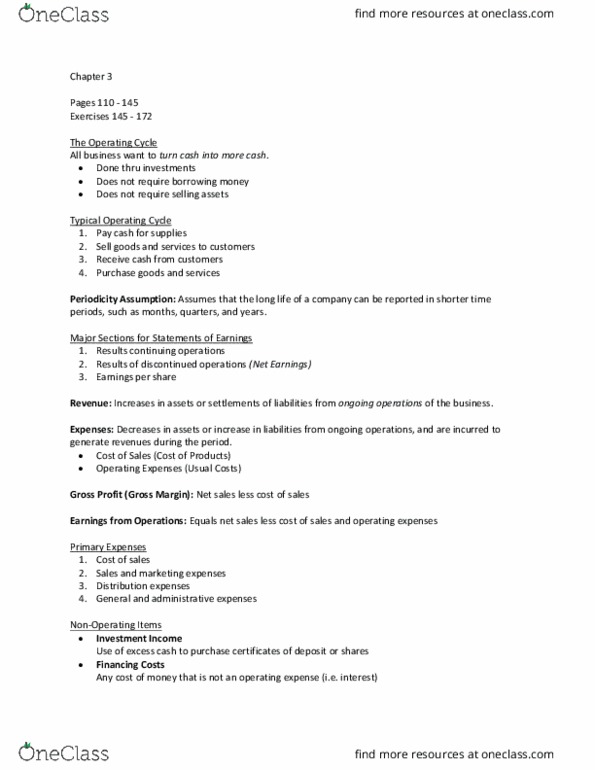
MGAB01H3 Chapter Notes - Chapter 3: Retained Earnings, Deferred Income, Asset Turnover


Get access


Related Documents
Related Questions
| Williams Company is a manufacturer of auto parts having the following financial statements for 2016. |
| Balance Sheet | ||
| December 31, 2016 | ||
| 2016 | ||
| Cash | $ | 280,000 |
| Accounts receivable | 170,000 | |
| Inventory | 405,000 | |
| Total current assets | $ | 855,000 |
| Long-lived assets | 1,840,000 | |
| Total assets | $ | 2,695,000 |
| Current liabilities | 420,000 | |
| Long-term debt | 920,000 | |
| Shareholder equity | 1,355,000 | |
| Total debt and equity | $ | 2,695,000 |
| Income Statement | ||
| For the years ended December 31, 2016 | ||
| 2016 | ||
| Sales | $ | 3,700,000 |
| Cost of sales | 2,900,000 | |
| Gross margin | 800,000 | |
| Operating expenses* | 520,000 | |
| Operating income | 280,000 | |
| Taxes | 98,000 | |
| Net income | $ | 182,000 |
| Cash Flow from Operations | |||||
| 2016 | |||||
| Net income | $ | 182,000 | |||
| Plus depreciation expense | 160,000 | ||||
| +Decrease (-inc) in Accounts receivable and Inventory | (155,000 | ) | |||
| +Increase (-dec) in Current liabilities | 125,000 | ||||
| Cash flow from operations | $ | 312,000 | |||
| *Operating expenses include depreciation expense. |
| Additional financial information, including industry averages for 2016, where appropriate includes: |
| 2016 | Industry 2016 | |||||||
| Capital expenditures | $ | 165,000 | ||||||
| Income tax rate | 35 | % | 35.0 | % | ||||
| Depreciation expense | $ | 160,000 | ||||||
| Dividends | $ | 30,000 | ||||||
| Year-end stock price | $ | 4.25 | 25.00 | |||||
| Number of outstanding shares | 2,000,000 | |||||||
| Sales multiplier | 1.50 | |||||||
| Free cash flow multiplier | 18.00 | |||||||
| Earnings multiplier | 9.00 | |||||||
| Cost of capital | 5 | % | ||||||
| Accounts receivable turnover | 11.10 | |||||||
| Inventory turnover | 10.50 | |||||||
| Current ratio | 2.30 | |||||||
| Quick ratio | 1.90 | |||||||
| Cash flow from operations ratio | 1.20 | |||||||
| Free cash flow ratio | 1.10 | |||||||
| Gross margin percentage | 30.0 | % | ||||||
| Return on assets (net book value) | 20.0 | % | ||||||
| Return on equity | 30.0 | % | ||||||
| Required: |
| Develop a business valuation for Williams Company for 2016 using the following methods: (1) book value of equity, (2) market value of equity, (3) discounted cash flow (DCF), (4) enterprise value, and (5) all the multiples-based valuations for which there is an industry average multiplier. For the calculation of the DCF valuation, you may use the simplifying assumption that free cash flows will continue indefinitely at the amount in 2016. |
Using the Amazon Financial Analysis (FY 2011 â FY 2008) and KeyRatio Comparison, calculate the missing values. (Enter youranswers in thousands of dollars. Round your answers to 2 decimalplace. Omit the "$" & "%" signs in your response.)
| Amazon Financial Analysis | |||||
| (data inthousands [000s], excluding per share data and financialratios) | FY2012 | ||||
| Revenue | $ | 61,093,000 | |||
| Costof Revenue | 44,271,000 | ||||
| Gross Profit | |||||
| Gross Profit Margin | |||||
| EBIT | 672,000 | ||||
| Income Tax | 428,000 | ||||
| NOPAT (Net Operating Profit After Taxes) | 244,000 | ||||
| NetIncome (includes discontinued operations) | $ | (39,000) | |||
| Diluted Weighted Average Shares | 453,000 | ||||
| Dividends per Share | - | ||||
| Diluted Normalized EPS (continuing operations) | (0.09) | ||||
| Cash Cycle | FY2012 | ||||
| Revenue per day | |||||
| Accounts Receivable | 2,600,000 | ||||
| Receivable Days | |||||
| Inventory | 6,031,000 | ||||
| Inventory Days | |||||
| Accounts Payable | 13,318,000 | ||||
| Payable Days | |||||
| Cash Cycle (days) | () | ||||
| Key Ratios | FY2012 | ||||
| Market Value of Book Equity | |||||
| Price per share* | 250.87 | ||||
| Earnings per share (continuing operations) | () | ||||
| P/ERatio | () | ||||
| Return on Invested Capital | 0.01 | ||||
| Return on Assets | () | ||||
| Return on Equity | () | ||||
| Return on Revenue | () | ||||
| Total Assets | 32,555,000 | ||||
| Current Assets | 21,296,000 | ||||
| Current Liabilities | 19,002,000 | ||||
| Current Ratio | |||||
| Total Liabilities | |||||
| Liabilities/Equity Ratio | |||||
| Total Equity (book value) | 8,192,000.0 | ||||
| Shareholders' Equity (minority interests) | - | ||||
| Market to Book Value | |||||
| Per Employee | FY2012 | ||||
| Number of Employees (continuing operations) | 88.4 | ||||
| Revenue | |||||
| NetIncome | () | ||||
| Market Value | |||||
| *Stock price obtained from Yahoo Finance at close of final dayof FY |

What are the Balance Sheet Ratios (debt-to-asset and debt-to-equity ratios) for the following financial information? (PLEASE SHOW WORK SO I CAN UNDERSTAND HOW THIS WAS DONE. Thank you)
| GENERAL ELECTRIC CO (GE) CashFlowFlag BALANCE SHEET | ||
| Fiscal year ends in December. USD in millions except per share data. | 2014-12 | 2015-12 |
| Assets | ||
| Current assets | ||
| Cash | ||
| Cash and cash equivalents | 90208 | 70483 |
| Short-term investments | 47907 | 31973 |
| Total cash | 138115 | 102456 |
| Receivables | 23237 | 27022 |
| Inventories | 17689 | 22515 |
| Other current assets | 233911 | 18834 |
| Total current assets | 412952 | 170827 |
| Non-current assets | ||
| Property, plant and equipment | ||
| Gross property, plant and equipment | 113321 | 90961 |
| Accumulated Depreciation | -46934 | -35927 |
| Net property, plant and equipment | 66387 | 54095 |
| Equity and other investments | 33822 | 12673 |
| Goodwill | 76553 | 65526 |
| Intangible assets | 14156 | 16745 |
| Deferred income taxes | 2541 | 3105 |
| Other long-term assets | 41938 | 169721 |
| Total non-current assets | 235397 | 321865 |
| Total assets | 648349 | 492692 |
| Liabilities and stockholders' equity | ||
| Liabilities | ||
| Current liabilities | ||
| Short-term debt | 79231 | 50810 |
| Accounts payable | 16338 | 13680 |
| Accrued liabilities | 12537 | 15776 |
| Other current liabilities | 54990 | 25764 |
| Total current liabilities | 163096 | 106030 |
| Non-current liabilities | ||
| Long-term debt | 222910 | 147466 |
| Deferred taxes liabilities | ||
| Pensions and other benefits | 40487 | |
| Minority interest | 8674 | 1864 |
| Other long-term liabilities | 125510 | 98571 |
| Total non-current liabilities | 357094 | 288388 |
| Total liabilities | 520190 | 394418 |
| Stockholders' equity | ||
| Preferred stock | 6 | |
| Common stock | 702 | 702 |
| Additional paid-in capital | 32889 | 37613 |
| Retained earnings | 155333 | 140020 |
| Treasury stock | -42593 | -63539 |
| Accumulated other comprehensive income | -18172 | -16528 |
| Total stockholders' equity | 128159 | 98274 |
| Total liabilities and stockholders' equity | 648349 | 492692 |
| GENERAL ELECTRIC CO (GE) CashFlowFlag INCOME STATEMENT | ||
| Fiscal year ends in December. USD in millions except per share data. | 2014-12 | 2015-12 |
| Revenue | 148589 | 117386 |
| Cost of revenue | 81311 | 82693 |
| Gross profit | 67278 | 34693 |
| Operating expenses | ||
| Sales, General and administrative | 30572 | 17831 |
| Other operating expenses | 9995 | |
| Total operating expenses | 40567 | 17831 |
| Operating income | 26711 | 16862 |
| Interest Expense | 9482 | 3463 |
| Other income (expense) | -5213 | |
| Income before taxes | 17229 | 8186 |
| Provision for income taxes | 1772 | 6486 |
| Net income from continuing operations | 15457 | 1700 |
| Net income from discontinuing ops | -112 | -7495 |
| Other | -112 | -331 |
| Net income | 15233 | -6126 |
| Preferred dividend | 18 | |
| Net income available to common shareholders | 15233 | -6144 |
| Earnings per share | ||
| Basic | 1.51 | -0.62 |
| Diluted | 1.5 | -0.61 |
| Weighted average shares outstanding | ||
| Basic | 10045 | 9944 |
| Diluted | 10123 | 10016 |
| EBITDA | 35994 | 16496 |
| GENERAL ELECTRIC CO (GE) Statement of CASH FLOW | ||
| Fiscal year ends in December. USD in millions except per share data. | 2014-12 | 2015-12 |
| Cash Flows From Operating Activities | ||
| Net income | 15345 | -6126 |
| Depreciation & amortization | 9283 | 4847 |
| Deferred income taxes | -1186 | 383 |
| (Gain) Loss from discontinued operations | 112 | 7495 |
| Accounts receivable | ||
| Inventory | -872 | -314 |
| Accounts payable | 305 | -541 |
| Other working capital | -2428 | -1048 |
| Other non-cash items | 7151 | 15195 |
| Net cash provided by operating activities | 27710 | 19891 |
| Cash Flows From Investing Activities | ||
| Investments in property, plant, and equipment | -13727 | -7309 |
| Property, plant, and equipment reductions | 6262 | 3020 |
| Acquisitions, net | 311 | -9744 |
| Sales/Maturities of investments | ||
| Other investing activities | 2124 | 73521 |
| Net cash used for investing activities | -5030 | 59488 |
| Cash Flows From Financing Activities | ||
| Debt issued | 37548 | 13951 |
| Debt repayment | -47038 | |
| Preferred stock issued | ||
| Common stock issued | 2842 | |
| Dividend paid | -8851 | -9295 |
| Other financing activities | -48497 | -33672 |
| Net cash provided by (used for) financing activities | -16958 | -76054 |
| Effect of exchange rate changes | -3492 | -3464 |
| Net change in cash | 2230 | -139 |
| Cash at beginning of period | 88787 | 91017 |
| Cash at end of period | 91017 | 90878 |
| Free Cash Flow | ||
| Operating cash flow | 27710 | 19891 |
| Capital expenditure | -13727 | -7309 |
| Free cash flow | 13983 | 12582 |
