STAB22H3 Chapter Notes - Chapter 8: Summary Statistics, Scatter Plot, Dependent And Independent Variables


38
STAB22H3 Full Course Notes
Verified Note
38 documents
Document Summary
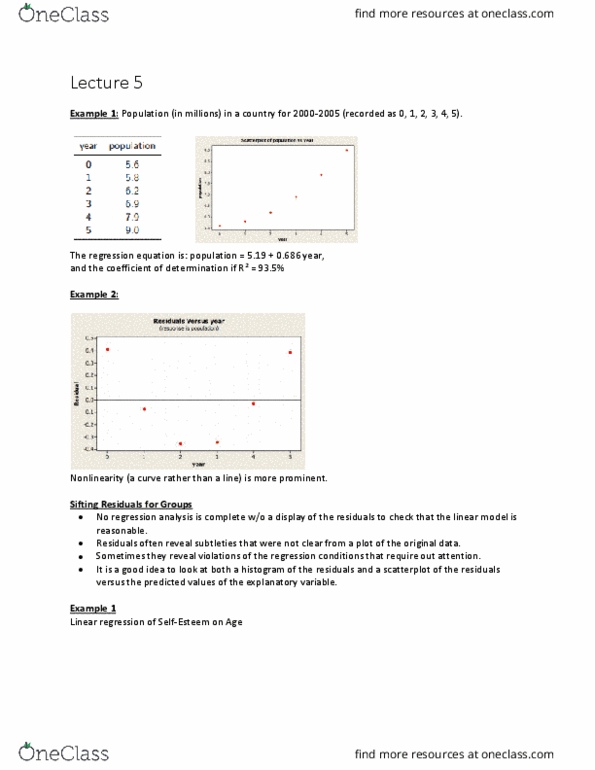
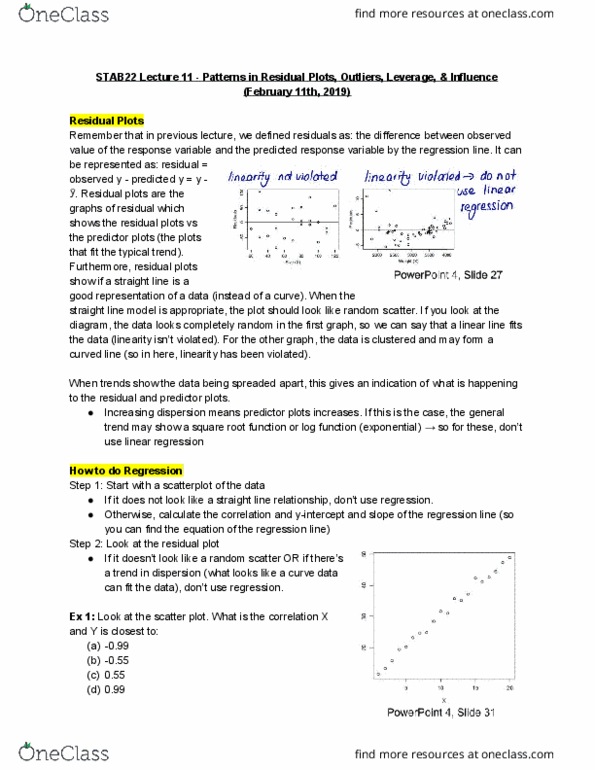
Nonlinearity: is a curve that is used instead of a line. It is necessary to make a residual plot in order to fully determine whether a linear model is appropriate for a set of data. A residual plot is a step of a good regression analysis. Residuals determine certain observations that were not clearly seen from the original data on a scatterplot, such as different groups within one set of data. In this case, it is sometime necessary to analyze the two different groups separately using different models. Residuals determine rules that were violated according to the conditions of the regressions. Sometimes it is necessary to look at a scatterplot and a histogram of the residuals, which shows the observed values against the predicted values. Outlier: a point that is away from the set of data. Outliers influence regression very much, even if it is only one point.