Biology 2244A/B Chapter Notes - Chapter 4: Standard Deviation, Scatter Plot, Dependent And Independent Variables

25 Dec 2016
School
Department
Course
Professor
Document Summary
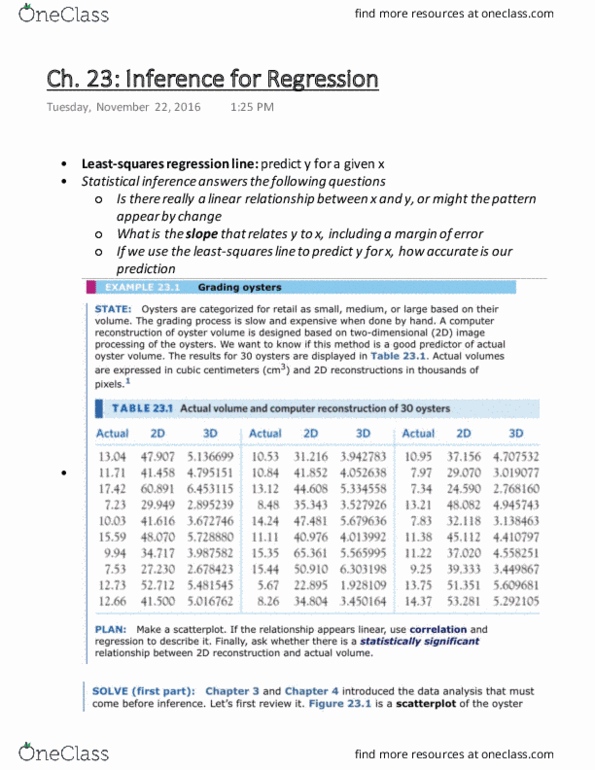
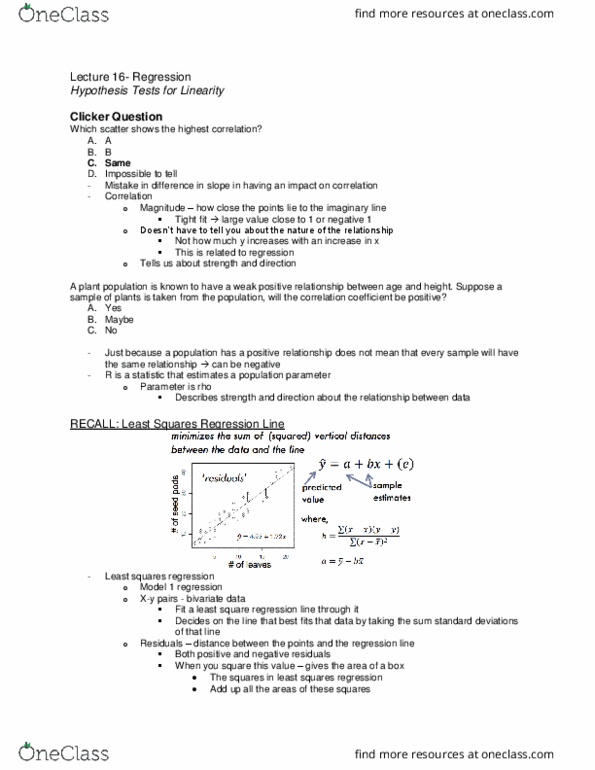
Summarizing overall pattern of scatterplot by drawing a line on the scatterplot. Regression line: straight line quansummarizes the relationship between 2 variables when one is thought to help explain or predict the other. Describes a relationship between explanatory and response variable. Used often to predict y for given x. Use this in terms of means and standard deviations of 2 variables and the correlation between them. Y^: predicted response of y for any x. Usually not the same as the observed response y. Rounding: can cause substantial inaccuracies when trying to predict y using equation for the least-squares regression line. Fact 1: the distinction between explanatory and response variables is essential in regression. Least squares regression makes distances of the data points from the line small n y direction. Reversing roles of variables: gets different least-square regression line. Fact 2: close connection between correlation and slope.