Statistical Sciences 2244A/B Chapter Notes - Chapter 1: Bar Chart, Categorical Variable

22 May 2018
School
Department
Professor

Stats 2244
Chapter 1
CHAPTER 1.1
Individuals and Variables
- Individuals: objects described by a set of data (can be people, animals, or things)
- Variable: any characteristic of an individual (can take different values for different individuals)
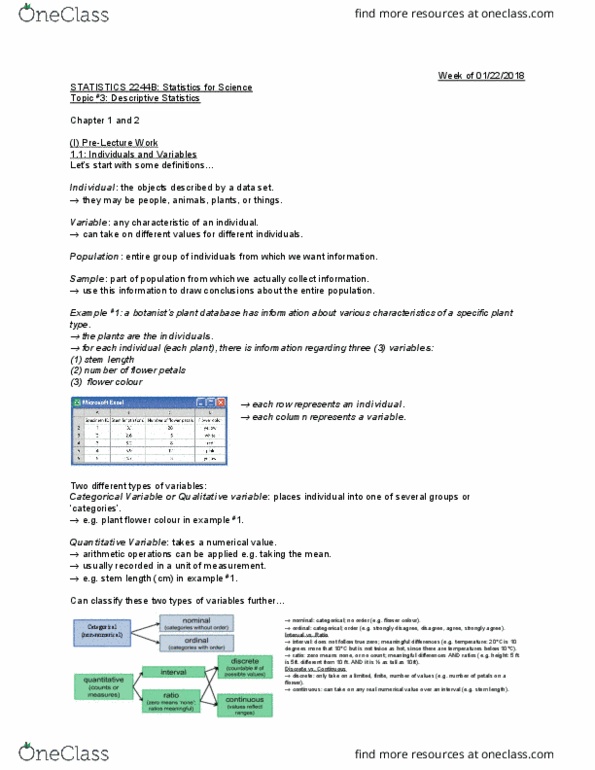
o Categorical variable: places an individual into one of several groups or categories
o Quantitative variable: takes numerical values for which arithmetic operations such as
adding and averaging make sense. The values of a quantitative variable are usually
recorded in a unit of measurement (ex: seconds or kilograms)
▪ Continuous variables:
• Type of quantitative variable
• take any real numerical value over an interval or ratio
• there are meaningful differences bw pairs of interval values but it does
not make sense to take ratios of them, while there are meaningful ratios
(and differences) bw pairs of ratio values
• ex: temp is interval data →it makes sense to say that 20 degrees is 10
degrees more than 10 degrees but 20 degrees is not twice as hot as 10
degrees
• ex: height is ratio data →it makes sense to say that a 10ft tree is twice as
tall as a 5ft tree
▪ discrete variables:
• type of quantitative variables:
• can take only a limited, finite # of values
• ex: # of petals on a flower
- when exploring data from someone elses work or when planning your own statistical study, ask
these questions:
o Who or what are the individuals studied? How many individuals appear in the data set?
o What do we record for each individual? How many variables do the data contain? What
are the exact definitions of these variables? In what units of measurement, if any, is each
variable recorded? Lengths, for example, might be recorded in inches, in yards, or in
meters.
o Why? What purpose do the data have? Do we hope to answer some specific
questions? Do we want to draw conclusions about individuals other than the ones we
actually have data for? Are the variables suitable for the intended purpose
CHAPTER 1.2
Categorical Variables: pie charts and bar graphs
Exploring Data
1. Begin by examining each variable by itself. Then move on to study the relationships among the
variables
2. Begin with a graph or graphs. Then add numerical summaries of specific aspects of the data
- To examine a single variable, we usually want to display its distribution
- Distribution of a variable:
o Tells us what values it takes and how often it takes these values
- Counts are sometimes called frequencies
o Ex: count of deaths for each category
- Percents are sometimes called relative frequencies
find more resources at oneclass.com
find more resources at oneclass.com
Document Summary
Individuals: objects described by a set of data (can be people, animals, or things) Are the variables suitable for the intended purpose. Exploring data: begin by examining each variable by itself. Then move on to study the relationships among the variables: begin with a graph or graphs. Then add numerical summaries of specific aspects of the data. To examine a single variable, we usually want to display its distribution. Distribution of a variable: tells us what values it takes and how often it takes these values. Counts are sometimes called frequencies: ex: count of deaths for each category. Bar graph: can compare any set of quantitites that are measured in the same units, clear at pointing to the order and the relative importance of the different categories. The distribution of a variable tells us what values the variable takes and how often it takes these values.