Statistical Sciences 2244A/B Chapter Notes - Chapter 19: Normal Distribution, Bias Of An Estimator, Confidence Interval

22 May 2018
School
Department
Professor

Stats 2244
Chapter 19
CHAPTER 19.1
The Sample Proportion, p hat
- We are interested in the unknown proportion p of a population that has some outcome
o Lets call this outcome we are looking for a success
- The behavior of sample proportions p hat is similar to the behavior of sample means, x bar
- When the sample size, n is large, the sampling distribution is approximately normal
- The larger the sample, the more nearly normal the distribution is
o Note: dont use the normal approximation to the distribution of p hat when the sample
size n is small
- p hat is an unbiased estimator of p (the population proportion)
- the standard deviation of p hat is and it gets smaller as the sample size n gets larger
o so that estimation is more accurate when the sample is larger
- as is the case for x bar, the SD gets smaller only at the rate
- the normal approximation to the sampling distribution of p hat is least accurate when p is close
to 0 or 1
o if p=0, successes are impossible as every sample has p hat =0 and no normal distribution
can model that
o if p=1, it works in the same way
- this means that we need larger n values for p near 0 or 1
- conditions for inference about a proportion:
o we can regard our data as a SIMPLE RANDOM SAMPLE from the population
▪ this is the most important condition
o the SAMPLE SIZE n IS LARGE ENOUGH to ensure that the distribution of p hat is close to
normal
▪ different inference procedures require different answer to the question “how
large is large enough?
- note: all our inference procedures require that the population be much larger than the sample
CHAPTER 19.2
Large-sample confidence intervals for a proportion
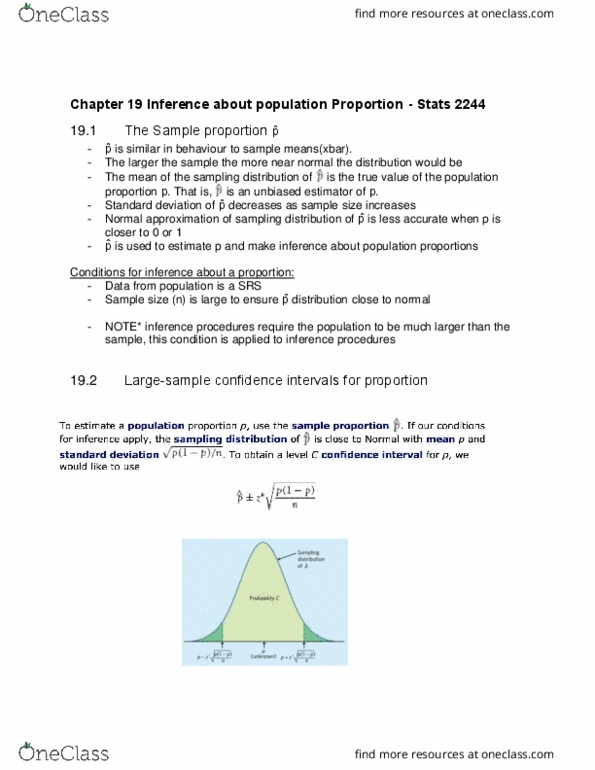
- To estimate a population proportion p, use the sample proportion .
- If our conditions for inference apply, the sample distribution of is close to Normal with mean p
and standard deviation .
- To obtain a level C confidence interval for p, we would like to use with the critical
value z* chosen to cover the central area C under the standard normal curve
find more resources at oneclass.com
find more resources at oneclass.com
Document Summary
The behavior of sample proportions p hat is similar to the behavior of sample means, x bar. When the sample size, n is large, the sampling distribution is approximately normal. The larger the sample, the more nearly normal the distribution is. Note: all our inference procedures require that the population be much larger than the sample. To estimate a population proportion p, use the sample proportion. If our conditions for inference apply, the sample distribution of and standard deviation is close to normal with mean p. To obtain a level c confidence interval for p, we would like to use with the critical value z* chosen to cover the central area c under the standard normal curve value of p. One way is to replace the standard deviation with standard error of p hat. Major problem of confidence intervals for a population proportion is that we don(cid:495)t know the. This interval has the form estimate z*seestimate.