Statistical Sciences 2244A/B Chapter Notes - Chapter 17: Confidence Interval, Simple Random Sample, Interval Estimation

22 May 2018
School
Department
Professor

Stats 2244
Chapter 17
CHAPTER 17.1
Conditions for inference
- Confidence intervals and tests of significance for the mean μ of a Normal population are based
on the sample mean
- Confidence levels and P-values are probabilities calculated from the sampling distribution of
- Here are the conditions needed for realistic inference about a population mean.
- Conditions for inference about a mean:
o We can regard our data as a simple random sample (SRS) from the population
o Observations from the population have a normal distribution with mean, μ and
standard deviation, σ
▪ Both μ and σ are unknown parameters
▪ In 2244, we state that the condition is that the sampling distribution be
approximately normal
o The population must be much larger than the sample
- Standard error:l
o When the standard deviation of a statistic is estimated from data, the result is called the
standard error of the statistic
o The standard error of the sample mean is .
CHAPTER 17.2
The t distributions
- If we knew the value of σ, we would base confidence intervals and tests for μ on the one-
sample z statistic
- This z statistic has the standard Normal distribution N(0, 1)
- In practice, we don’t know σ, so we substitute the standard error of for its standard
deviation
- The statistic that results does not have a Normal distribution - t has a distribution that is new to
us, called a t distribution.
- The one sample t statistic and the t distribution
o Draw an SRS of size n from a large population that has the normal distribution with
mean μ and SD σ
o The one sample t –statistic below has the t-distribution with n-1 degrees of freedom
- The t statistic has the same interpretation as any standardized statistic: It says how far is from
its mean (μ) in standard error units ( )
- Sample standard deviations obtained with larger samples are better estimates of the unknown
population standard deviations σ
o This is reflected in the fact that there is a different t distribution for each sample size
o We specify a particular t distribution by giving its degrees of freedom (df)
o When doing inference about a single population mean μ, the t statistic follows
a t distribution with n − 1 degrees of freedom.
- Comparing the density curves of the standard normal distribution and of the t-distribution with
2 and 9 degrees of freedom :
find more resources at oneclass.com
find more resources at oneclass.com

o The density curves of the t distributions are similar in shape to the standard normal
curve
▪ They are symmetric about 0, single-peaked, and bell-shaped.
o The spread of the t distributions is a bit greater than that of the standard Normal
distribution
▪ The t distributions in the image have more probability in the tails and less in the
center than does the standard Normal distribution.
▪ This is true because substituting the estimate s for the
fixed parameter σ introduces more variation into the
statistic. (Therefore, inference will be generally less precise.)
o As the degrees of freedom increase, the t density curve approaches the N(0, 1) curve
ever more closely
▪ This happens because s estimates σ more accurately as the sample size
increases. So using s in place of σ causes little extra variation when the sample is
large.
- Critical values are values of a random variable that correspond to a particular probability
CHAPTER 17.3
The one sample t confidence interval
- To analyze samples from Normal populations with unknown σ, just replace the standard
deviation of by its standard error in the zprocedures.
- The confidence interval and test that result are one-sample t procedures. Critical values and P-
values come from the tdistribution with n − 1 degrees of freedom. The one-sample t procedures
are similar in both reasoning and computational detail to the z procedures.
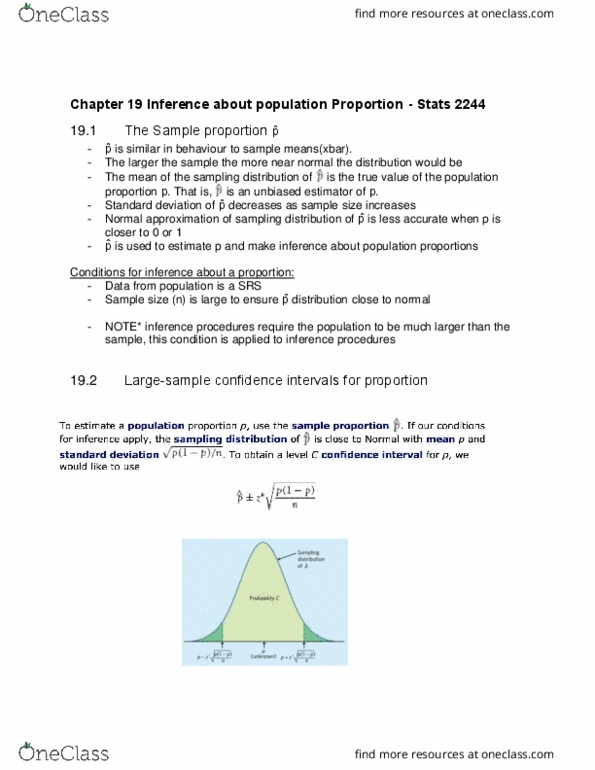
- The one sampel t confidence interval:
o Draw an SRS of size n from a large population having unknown mean, μ
o A level C confidence interval for μ is…
o Where t* is the critical value for the t(n-1) density curve with area C between –t* and t*.
o This interval is exact when the population distribution is normal and is approximately
correct for large n in other cases
- Example:
find more resources at oneclass.com
find more resources at oneclass.com

- because we do not know the true value of the population standard deviation σ, we use the
sample standard deviation s = 0.1115 calculated from the data. We also use the t critical value t*
= 2.064 for 24 degrees of freedom instead of the standard Normal critical value z* = 1.960.
- The one-sample t confidence interval has the form
- estimate ± t*SEestimate (where SE stands for standard error.)
find more resources at oneclass.com
find more resources at oneclass.com
Document Summary
Confidence intervals and tests of significance for the mean of a normal population are based on the sample mean. Confidence levels and p-values are probabilities calculated from the sampling distribution of. Here are the conditions needed for realistic inference about a population mean. In 2244, we state that the condition is that the sampling distribution be approximately normal: the population must be much larger than the sample. Standard error:l: when the standard deviation of a statistic is estimated from data, the result is called the standard error of the statistic, the standard error of the sample mean is. If we knew the value of , we would base confidence intervals and tests for on the one- sample z statistic deviation us, called a t distribution. The statistic that results does not have a normal distribution - t has a distribution that is new to. This z statistic has the standard normal distribution n(0, 1)