PS296 Chapter Notes - Chapter 5: Interquartile Range, John Tukey, Winsorizing


Boxplots: Graphical Representations of Dispersion and Extreme Scores
-boxplots (also John Tukey) give greater prominence to the dispersion of the data
-alsoc called box and whisker plot
-horizontal line of boxplot is drawn at the median
-next step is to take what amounts to the medians of each half of the ordered distribution
(the first and third quartiles/25th and 75th percentiles) called hinges
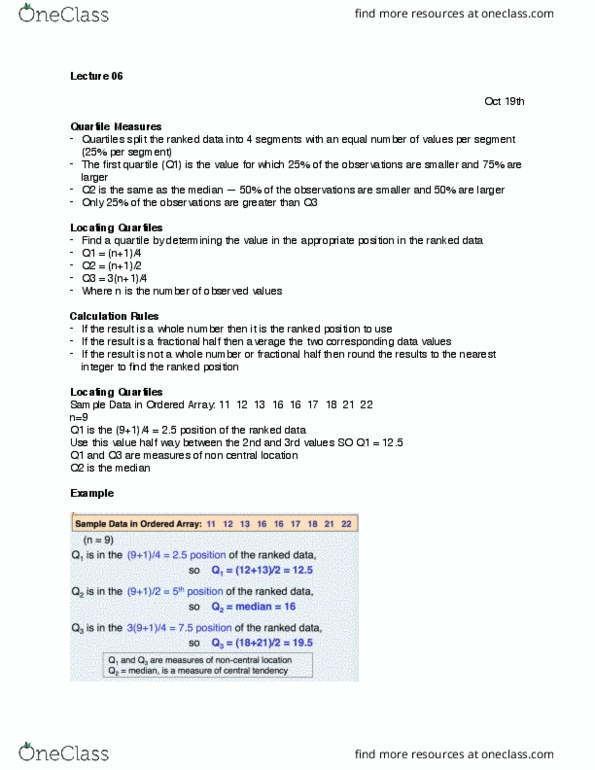
-to find the quartile location:
Quartile location = median location + 1
2
-the quartile location tells us where, in an ordered series, the quartile values are to be
found
-count from the bottom and top of the ordered values
-first and third quartiles will bracket the middle 50% of cores
-next we need to interquartile range, which is the range of values remaining after we cut
off the lower and upper quartiles (h-spread)
-the next step is to draw a line/whisker from the top and bottom of the box to the farthest
point that is no more than 1.5 times the interquartile range
-astericks represent values that are so extreme they lie outside the whiskers (outliers) and
could be correct extreme values or errors
Document Summary
Boxplots: graphical representations of dispersion and extreme scores. Boxplots (also john tukey) give greater prominence to the dispersion of the data. Horizontal line of boxplot is drawn at the median. Next step is to take what amounts to the medians of each half of the ordered distribution (the first and third quartiles/25th and 75th percentiles) called hinges. The quartile location tells us where, in an ordered series, the quartile values are to be found. Count from the bottom and top of the ordered values. First and third quartiles will bracket the middle 50% of cores. Next we need to interquartile range, which is the range of values remaining after we cut off the lower and upper quartiles (h-spread) The next step is to draw a line/whisker from the top and bottom of the box to the farthest point that is no more than 1. 5 times the interquartile range.