MGMT 1050 Chapter Notes - Chapter 3: Histogram, Skewness, Ogive

Document Summary
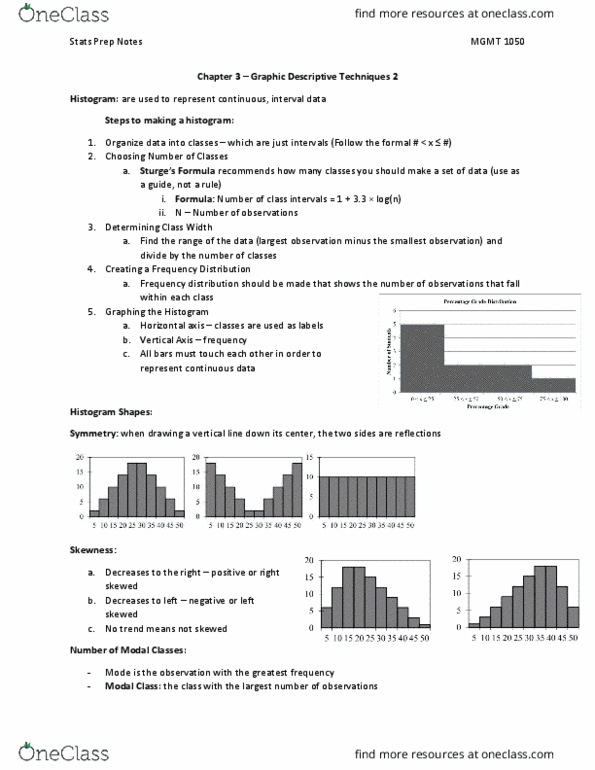
3. 1: graphical techniques to describe a set of interval data. Histogram is an important tool to summarize interval data. 1-10, 11-20, 21-30) that cover the complete range of data values. Histogram: a bar graph, but represents the frequency of categorized data values (pg 47) Depends entirely on the number of observations in the data set. Ex. n=50, number of class intervals= 1+3. 3 log(50) = 6. 6, round to 7. The purpose of drawing histograms is to acquire information. Symmetry: when a line is drawn in the centre, the two sides are equal. Modal classes: the class with the largest number of observations (mode) Bimodal histogram: one with two peaks, not necessarily equal in height. Bell shape: special type of symmetric unimodal histogram that is symmetrical, and has two equal peaks. Drawbacks of histogram: lose potential useful information by classifying the observation into groups. Histogram focuses on the frequency of each class: sacrifices the actual observation collected.