MATH 10041 Chapter 2: Chapter 2 Learning Outcomes

12 Feb 2019
School
Department
Course
Professor
Document Summary
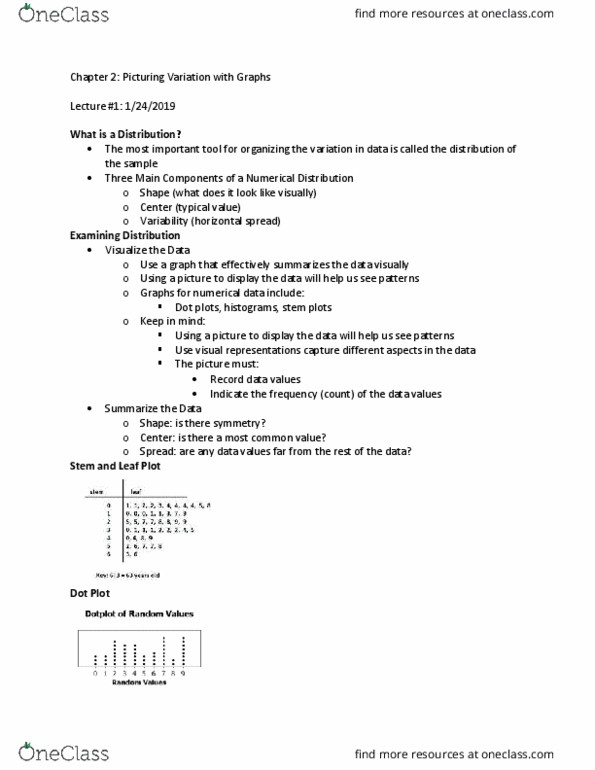
Numerical data: data that is expressed with digits as opposed to letters or words, example: the weight of the desk or the height of a building. Dotplots: a type of simple histogram-like chart used in statistics for relatively small data sets wher values fall into a number of discrete bins. Histograms: a plot that lets you discover, and show, the underlying frequency distribution (shape) of a set of continuous data. Stemplots: used to display quantitative data, generally from small data sets (50 or fewer observations) Summarizing a distribution: when data are in their original form, as collected, they are called raw data. Center: the mean, an average of the data. Right-skewed: positively skewed, piles up on the right, trails off on the left. Left-skewed: negatively skewed, piles up on the left, trails off on the right. Outliers: an observation that lies outside of the overall pattern of a distribution.