STAT 1100 Chapter Notes - Chapter 2: Infor, Floor And Ceiling Functions, Informa

Document Summary
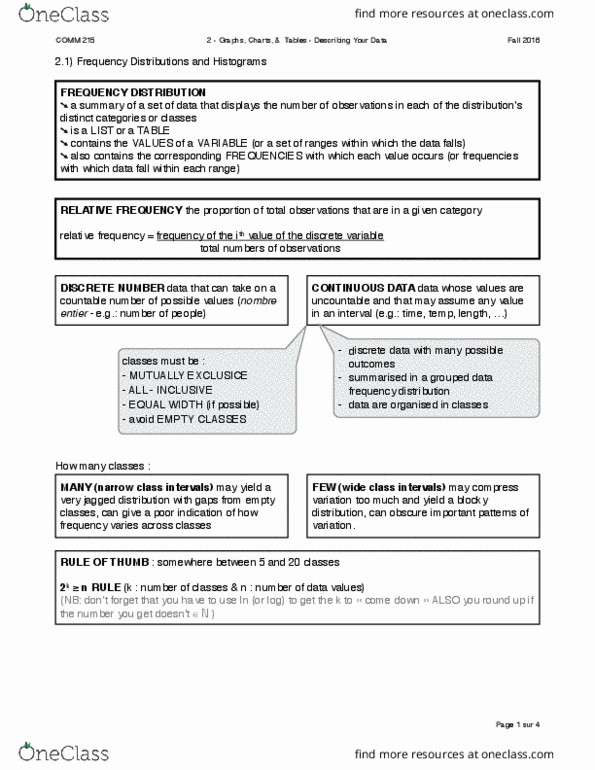
Assume you have access to a set of n points/data that is relevant to you or someone you work for. Our rst goal is to characterize the distribution of values observed in this data. We will say that data is discrete if the values they take belong to a countable set. In other words, we could index all its elements by using integers numbers. We will say data is continuous if it takes values on an uncountable set of numbers, such as the real numbers. The frequency distribution of a set of observations is a summary table that shows the number of observations (frequency) that belong to each class or category associated to the data. Consider a discrete variable tak- ing values on the set {1, . If we collected a total of n ob- servations, then the relative frequency of the i-th value is the ratio.