MATH 273 Chapter Notes - Chapter 1: Scatter Plot

30 May 2018
School
Department
Course
Professor

a. Make a scatterplot. Describe association between rankings in 2007 and 2008. If
appropriate, carry on with analysis below.
The residual plot indicates that most of the data fall roughly along a straight line thus also
indicating that it is appropriate.
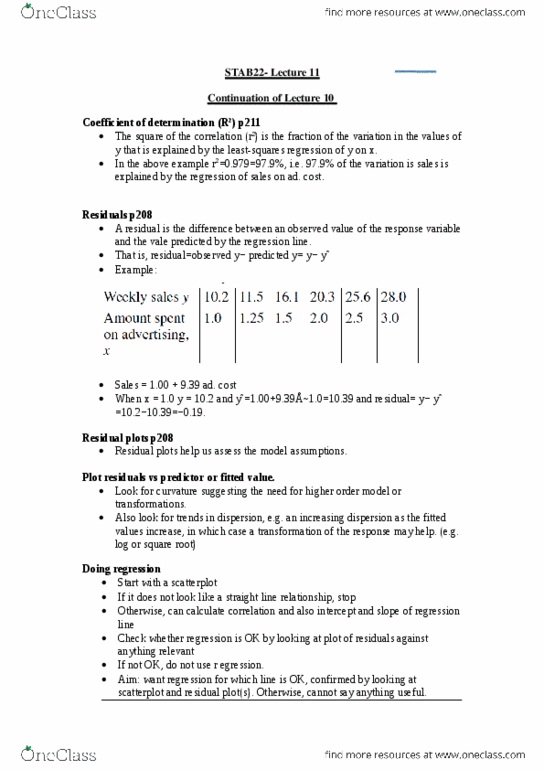
b. Find the correlation and the regression equation predicting the 2008 cost of living
ranking from 2007 cost of living.
R (correlation coefficient) = 0.93769339
Regression equation: Y = 21.750377 + 0.84228724. Cost 07
c. Interpret the slope and y-intercept, if appropriate.
Slope = 0.84228724
Y-intercept = 21.750377
d. Find the residual for Oslo, and explain what it means.
Oslo (105.8, 118.3)
Y = 21.750377 + 0.84228724. Cost 07
21.750377 + 0.84228724 (105.8) = 110.864367
Residual = 118.3 – 110.864367 = 7.435633
The residual is 7.435633. the residual means that according to the model, it predicted the
living cost for Oslo to be $110.9, but the actual cost for living in Oslo is $118.3. The
model underpredicted the cost of living in Oslo by a factor of 7.435633.
e. What would you predict for a city that had a 2007 ranking of 113? What about 58?
find more resources at oneclass.com
find more resources at oneclass.com