This is just information the question will be next photo
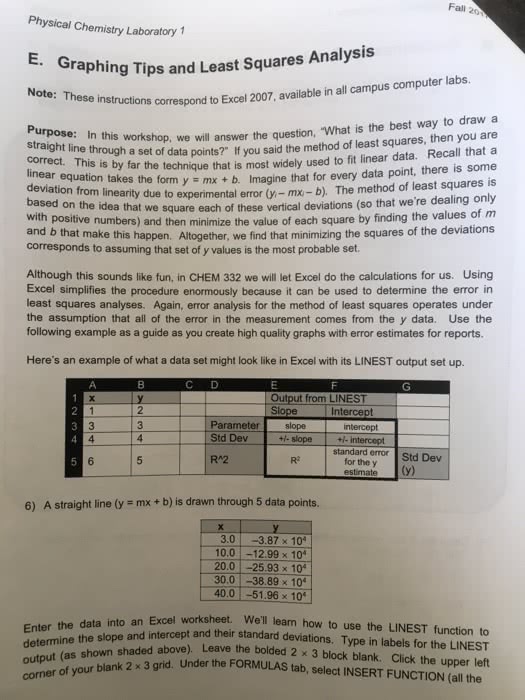
In this workshop, we will answer the question. "What is the best way to draw a straight line through a set of data points?" If you said the method of least squares, then you are correct. This is by far the technique that is most widely used to fit linear data. Recall that a linear equation takes the form y = mx + b. Imagine that for every data point, there is some deviation from linearity due to experimental error (y_i - mx_i - b). The method of least squares is based on the idea that we square each of these vertical deviations (so that we're dealing only with positive numbers) and then minimize the value of each square by finding the values of m and b that make this happen. Altogether, we find that minimizing the squares of the deviations corresponds to assuming that set of y values is the most probable set. Although this sounds like fun, in CHEM 332 we will let Excel do the calculations for us. Using Excel simplifies the procedure enormously because it can be used to determine the error in least squares analyses. Again, error analysis for the method of least squares operates under the assumption that all of the error in the measurement comes from the y data. Use the following example as a guide as you create high quality graphs with error estimates for reports. Here's an example of what a data set might look like in Excel with its LINEST output set up. A straight line (y = mx + b) is drawn through 5 data points. Enter the data into an Excel worksheet. We'll learn how to use the LINEST function to determine the slope and intercept and their standard deviations. Type in labels for the LINEST output (as shown shaded above). Leave the bolded 2 times 3 block blank. Click the upper left corner of your blank 2 times 3 grid. Under the FORMULAS tab, select INSERT FUNCTION (all the