SCMA 301 Chapter Notes - Chapter 3: Bar Chart, Unimodality, Squared Deviations From The Mean

30 Mar 2017
School
Department
Course
Professor
Document Summary
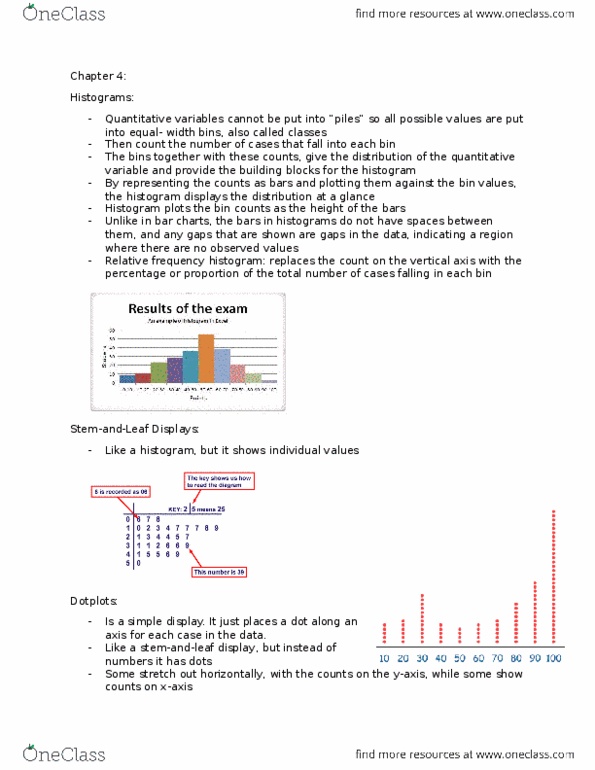
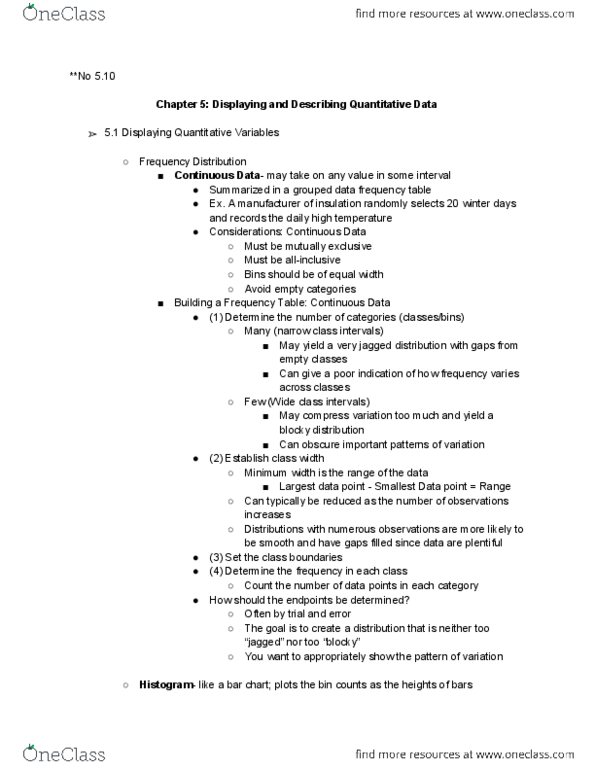
Gaps indicate a region where there are no values. Can be important features of the distribution so watch out for them and point them out: vertical axis of a histogram shows the number of cases falling in each bin, relative frequency histogram. A report of the percentage of cases in each bin. Shape of the two histograms is the same. Only the vertical axis and labels are different. Faithful to the area principle by displaying the percentage of cases in each bin instead of count. Bar chart: puts gaps between bars to separate the categories. Stem and leaf displays: they"re like histograms, but they also show the individual values, quantitative data collection the data must be values of a quantitative variable whose units are known. When describing a distribution, pay attention to: shape, center, spread. Distributions whose histograms have two humps: multimodal.