L11 Econ 1011 Lecture 4: Quiz 4 Econ1011_KEY

22 Oct 2015
School
Department
Course
Professor

Document Summary
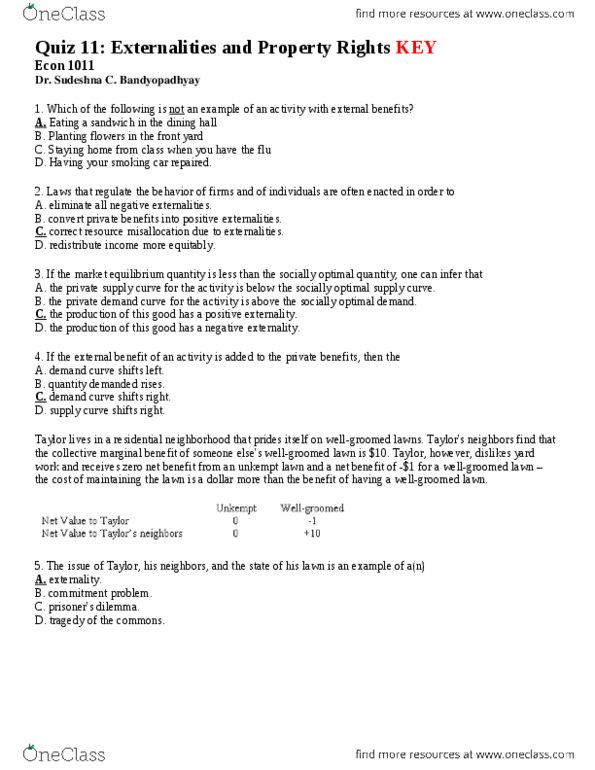
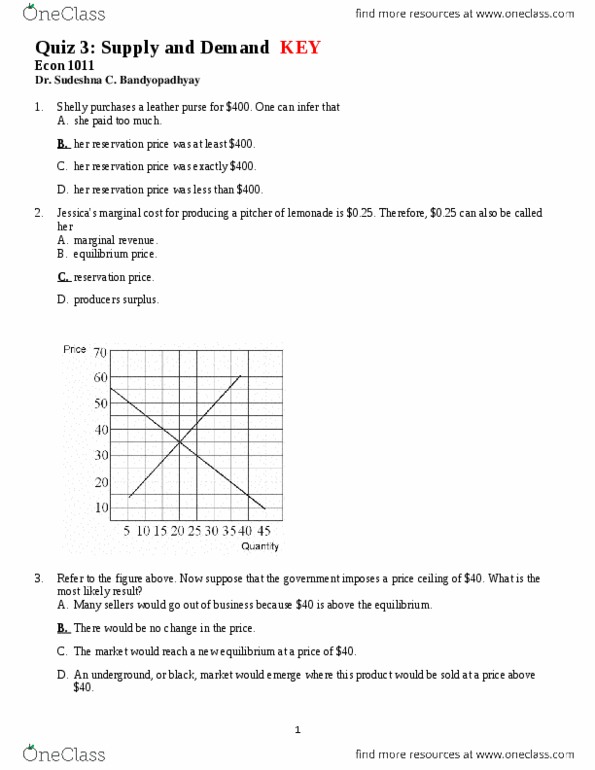
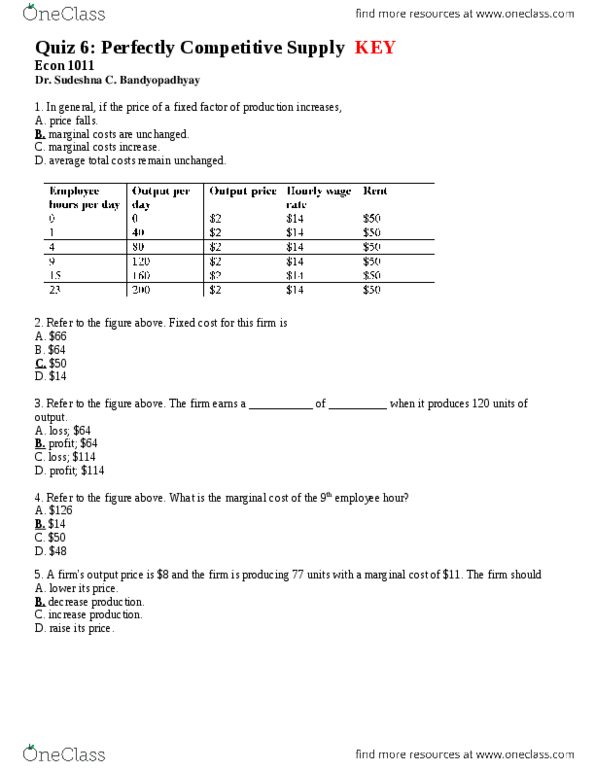
Use the mid-point average formula: 1. 5, 0. 6, 3 bottles of wine, , 4. 2, a 10% decline in the price of oranges leads to a 15% decline in the quantity of pears demanded. When the price of insulin was consumers demanded 100 units, when the price was consumers demanded 100 units, and when the price was consumers demanded 100 units. Based on this information, insulin must have a(n) _______ demand curve: unitary elastic, perfectly elastic, perfectly inelastic, elastic. The figure above depicts a market for cigarettes. The initial demand curve is d0 and the initial supply curve is s0. The government imposes an excise tax of on every carton of cigarette sold. So s1 is the post-tax supply curve for cigarettes. B is the pre-tax equilibrium and a is the post-tax equilibrium. Indeed sellers and buyers (same thing as consumers) share the burden.