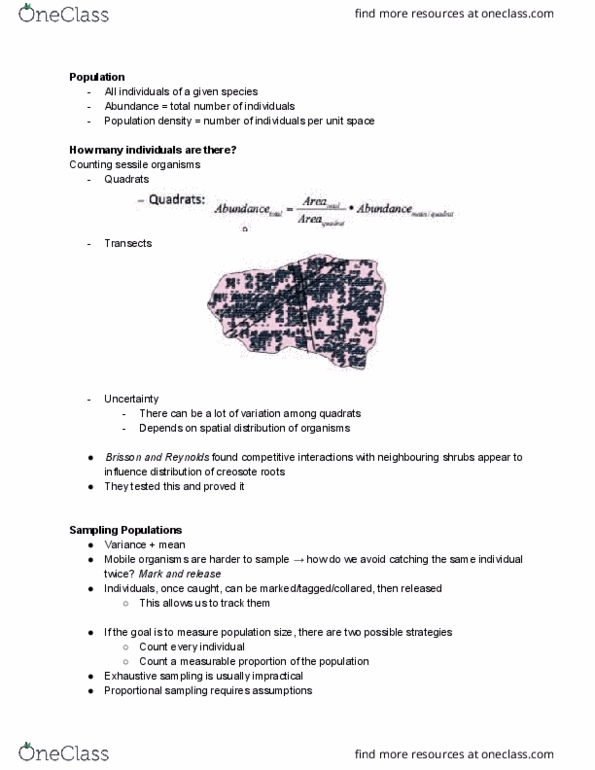
Lab 2 patterns of spatial distribution: a. 3. 17/1. 08= 2. 94: to determine the distribution pattern of a sample or population, there must be quadrats created. These are small areas of the sample in which researchers can count how many entities are in random quadrats that are set up (rauschert, gibbson, and gore panter 2021). Then, calculate the mean and the variance for each data set. To do this, take the sum of all the data collected and then divide it by the number of samples taken (urry et. al. For the variance, calculate deviation and subtract it from each group of individuals per quadrant. Then, sum up those numbers and divide them by how many samples are taken, minus one (rauschert, gibbson, and gore panter 2021). Finally, calculate the variance-to-mean ratio or the index of dispersion. To do this, take the individuals variance and divide it by the mean (rauschert, gibbson, and gore panter 2021).