STAT1008 Lecture Notes - Lecture 3: Confidence Interval, Statistical Parameter, Interval Estimation

3.1 CONFIDENCE INTERVALS
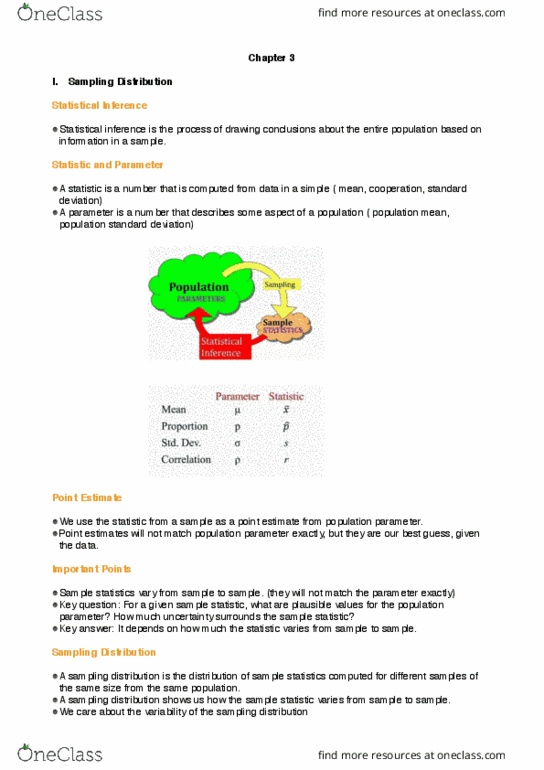
Statistical inference
- Statistical inference is the process of drawing conclusions about the entire population based
information in a sample.
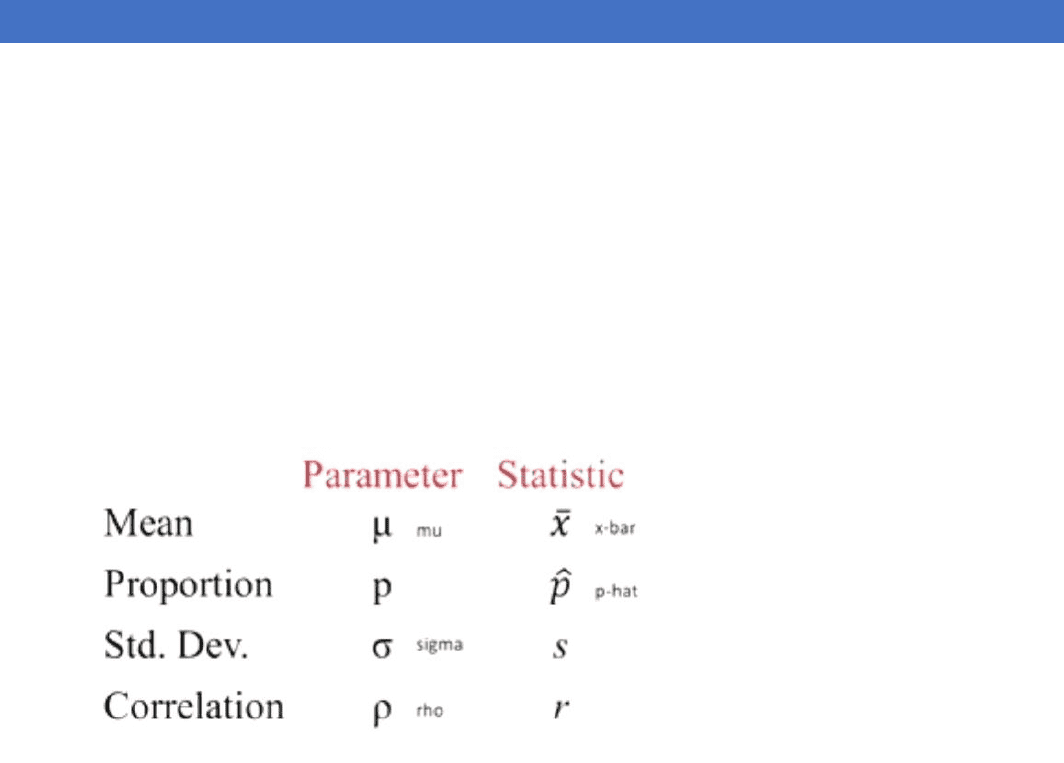
Statistic and Parameter
- A parameter is a number that describes some aspect of a population
- A statistic is a number that is computed from data in a sample.
- Usually have a sample statistic and want to use it to make inferences about the population
parameter
Parameter versus Statistic
- For each of the following, state whether the quantity described is a parameter or a statistic, and
give the correct notation.
o Average household income for all houses in the US, using data from US census: parameter
o Correlation between height and weight for players on the 2010 Brazil world cup team, using
data from all 23 players on the roster: statistic
o Proportion of people who use an electric toothbrush, using data from a sample of 300
adults: statistic
Election Polling
- Newspoll, amongst others, polls a sample of Australians on who they are likely to vote for in the
next election.
- On the two party preferred basis, currently ALP leads Coalition by 53% to 47%
- These polls are used to gauge how the general population will vote
Point Estimate
- We use the statistic from a sample as a point estimate for a population parameter
- Point estimates will not match population parameters exactly, but they are out best guess, given
the data.
Important Points
- Sample statistics vary from sample to sample. (they will not match the parameter exactly)
find more resources at oneclass.com
find more resources at oneclass.com
- KEY QUESTION: For a given sample statistic, what are plausible values for the population
parameter? How much uncertainty surrounds the sample statistic?
- KEY ANSWER: It depends on how much the statistic varies from sample to sample!
Many Samples
- To see how statistics vary from sample to sample, lets take a saples ad opute a
statistics!
Sampling Distribution
- A sampling distribution is the distribution of sample statisitcs computed for different samples of the
same size from the same population
- A sampling distribution shows us how the sample statistic varies from sample to sample
Center and Shape
- Centre: if samples are randomly selected, the sampling distribution will be centered around the
population parameter
- Shape: for most of the statistics we consider, if the sample size is large enough the sampling
distribution will be symmetric and bell-shaped
Sampling Caution
- If you take random samples, the sampling distribution will be centered around the true population
parameter
- If sampling bias exists (if you do not take random samples), your sampling distribution may give you
bad information about the true parameter
Sampling Distribution
- Wee leared aout eter ad shape, ut remember what we really care about is variability of
the sampling distribution
- Remember our key question and answer: to assess uncertainty of a statistic, we need to know how
much the statistic varies from sample to sample!
- The variability of the sample statistic is so important that it gets its o ae…
Standard Error
- The standard error of a statistic, SE, is the standard deviation of the sample statistic
- The standard error measures how much the statistic varies from sample to sample
- The standard error can be calculated as the standard deviation of the sampling distribution
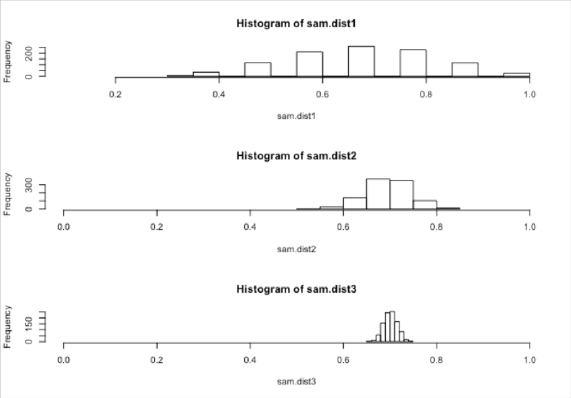
Sample Size Matters
- As the sample size increases, the
variability of the sample statistics tends
to decrease and the sample statistics
tend to be closer to the true value of the
population parameter
- For larger sample sizes, you get less
variability in the statistics, so less
uncertainty in your estimates
- E.g. proportion of Canberrans with a
university degree. Population: N = 280,
=; p:.. Lets stiulate soe
samples from this proportion in R.
find more resources at oneclass.com
find more resources at oneclass.com

Summary
- Statistical inference is drawing conclusions about a population based on a sample
- We use a sample statistic to estimate a population parameter
- To assess the uncertainty of a statistic, we need to know how much it varies from sample to sample
- To create a sampling distribution, take many samples of the same size from the population, and
compute the statistic for each
- Standard error is the standard deviation of a statistic
3.2 UNDERSTANDING AN D INTERPRETING CONFI DENCE INTERVALS
Employer-Based Health Insurance
- A report from a Gallup poll in 2011 based on a random sample of n = 147,291 adults says
- Fort-five percent of American adults reported gettig their health isurae fro a eploer…
- How accurate is 45%???
Interval Estimate
- An interval estimate gives a range of plausible values for a population parameter
Margin of Error
- One common form for an interval estimate is statistic ± margin of error where the margin of error
reflects the precision of the sample statistic as a point estimate for the parameter.
Employer-Based Health Insurance
- Fort-five percent of American adults reported gettig their health isurae fro a eploer…
- Later in the report, it says the aiu argi of saplig error is ± peretage poit
- Interval estimate: 45% ± 1% = (44%, 46%)
- The percentage of American adults getting their health insurance from an employer is probably
between 44% and 46%
Margin of Error
- How do we determine the margin of error???
- We can use the spread of the sampling distribution (the standard error) to determine the margin of
error for a statistic
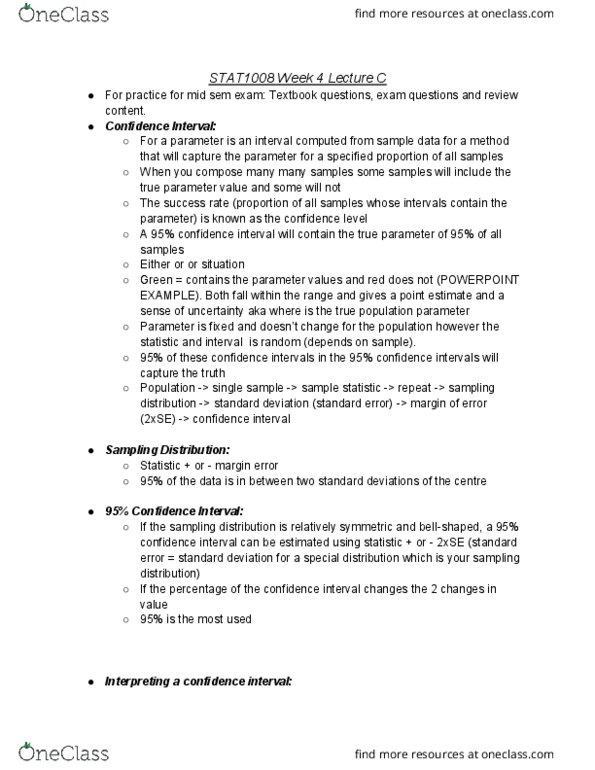
Confidence Interval
- A confidence interval for a parameter is an interval computed from sample data by a method that
will capture the parameter for a specified proportion of all samples
- The success rate (proportion of all samples whose intervals contain the parameter) is known as the
confidence level
- A 95% confidence interval will contain the true parameter for 95% of all samples
- The parameter is fixed
- The statistic is random (depends on the sample)
- The interval is random (depends on the statistic)
- 95% of 95% confidence intervals will capture the truth
Sampling Distribution
- If you had access to the sampling distribution, how would you find the margin of error to ensure
that intervals of the form statistic ± margin of error
- Would capture the parameter for 95% of all samples
find more resources at oneclass.com
find more resources at oneclass.com
Document Summary
Statistical inference is the process of drawing conclusions about the entire population based information in a sample. A parameter is a number that describes some aspect of a population. A statistic is a number that is computed from data in a sample. Usually have a sample statistic and want to use it to make inferences about the population parameter. Newspoll, amongst others, polls a sample of australians on who they are likely to vote for in the next election. On the two party preferred basis, currently alp leads coalition by 53% to 47% These polls are used to gauge how the general population will vote. We use the statistic from a sample as a point estimate for a population parameter. Point estimates will not match population parameters exactly, but they are out best guess, given the data. Sample statistics vary from sample to sample. (they will not match the parameter exactly)