ECON10005 Lecture Notes - Lecture 5: Total Variation, Variance

27 Jul 2018
School
Department
Course
Professor
Document Summary
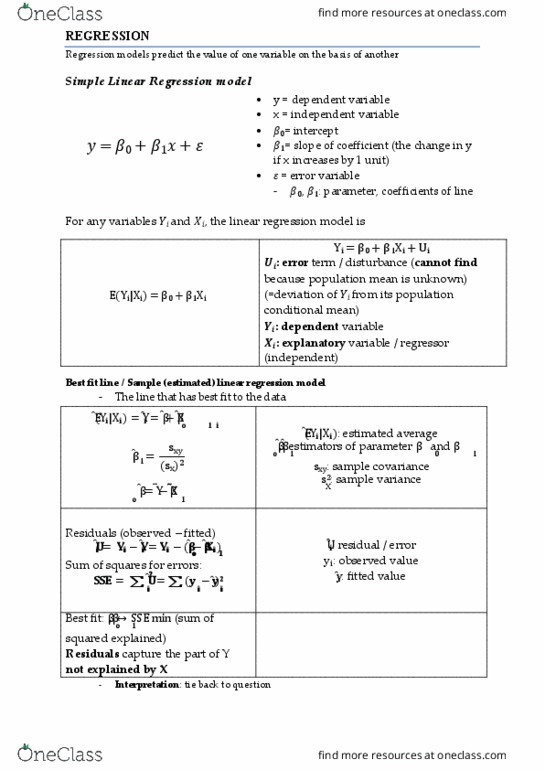
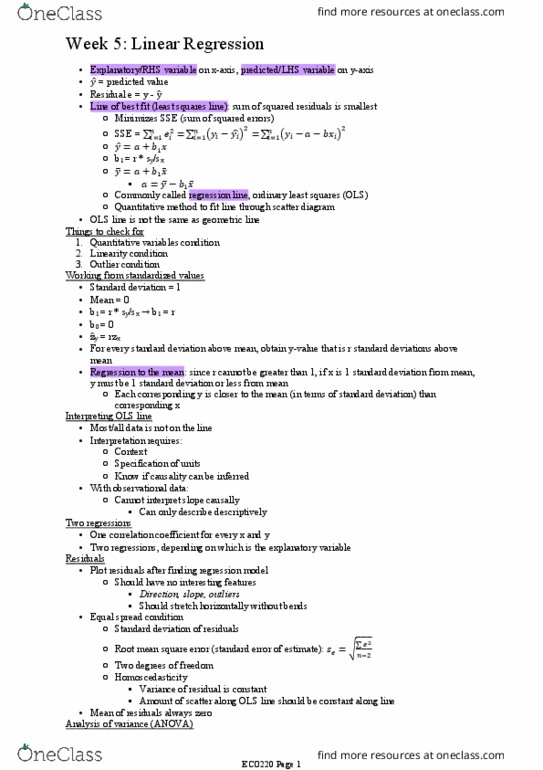
If two variables are perfectly linearly related we can represent their relationship using a linear function y is the dependent variable x is the explanatory variable b0 represents the intercept b1 is a slope coefficient. In order to fit a line we first need to choose b0 and b1. To find the line we need to find the values of b0 and b1 such that the area between the "errors"/deviations and the line is minimised: Line of best fit - ordinary least squares (ols) Take the derivative of the above function with respect to b1 and set it equal to 0. Take the derivative of the sse function with respect to b0 and set it equal to 0. Dividing out the -2, we have two equations and two unknowns. Solve for b1 by rewriting the previous equation. Can rewrite b1 in terms of the quantities we already know a. Finally multiplying and dividing by 1/(n-1) we get.