PSYC20009 Lecture Notes - Lecture 3: Landline, Less Than Perfect, Regression Analysis

14 Jun 2018
School
Department
Course
Professor

Lecture 2 - Monday 31 July 2017
PSYC20009 - PERSONALITY & SOCIAL PSYCHOLOGY
LECTURE 3
REGRESSION
TODAY
•1. The regression model
•2. Least squares solution: maths behind how to calculate parameters of regression model using
least squares estimation.
•3. Explained variation
•4. F test for regression
•5. Regression parameters
•6. Regression diagnostics
•7. SPSS Examples
•8. Write-up
•9. Towards multiple regression
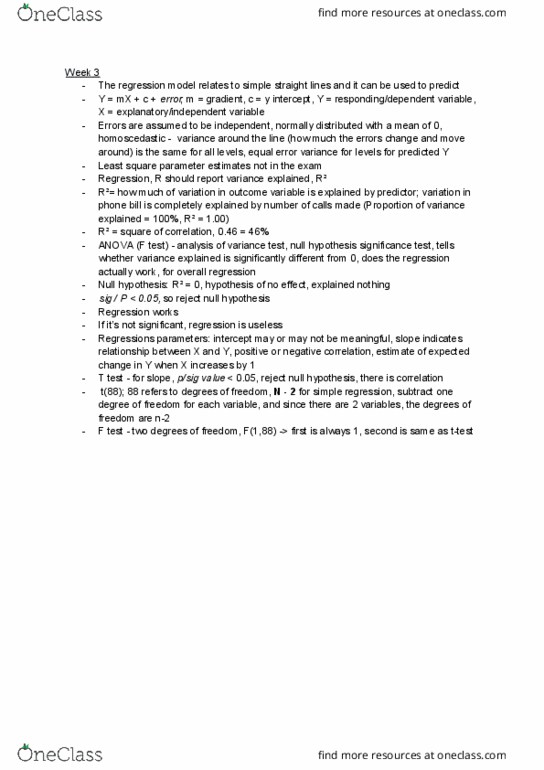
1. THE REGRESSION MODEL
•Main point of this section: You don’t have to know the mathematical details, but you do have to
understand how the regression model relates to simple
straight lines and how it can be used to predict.
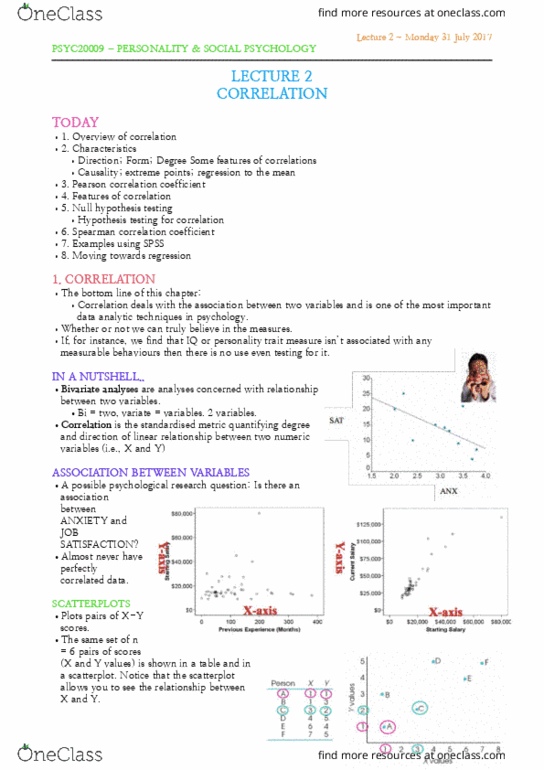
EXAMPLE 1: A LINEAR RELATIONSHIP BETWEEN
2 VARIABLES
•Eg. Rate of Goods and Services Tax (GST) is 10%. GST =
0.1 × (Untaxed price)
•A perfect correlation: so we can predict GST for any pre-
tax price perfectly.
•(Just
multiply
any pre-
tax price
by 0.1 to
predict
GST!)
EXAMPLE 2:
•Landline phone bill: $30 per month subscription, plus
20 cents for every local call. Monthly bill = 30 + 0.20
× (no of calls)
•A perfect correlation: so we can predict the bill for any
number of calls perfectly. (Just multiply any no. of calls
by 0.20 and add 30!)

Lecture 2 - Monday 31 July 2017
PSYC20009 - PERSONALITY & SOCIAL PSYCHOLOGY
EXAMPLE 3: A LESS THAN PERFECT LINEAR
RELATIONSHIP
•Relationship between verbal ability and IQ in children.
•Regression:
•What is the best linear relationship of the form
•Y =a +b X for this data?
•What is the line of best fit?
•Line of best fit (or regression line) Verbal = - 12 + 0.61 ×
(IQ)
•For every increment in x, that’s how much the y value
increases.
•The slope of the correlation line and the correlation are
different. Could have a narrow slope and perfect correlation,
or a moderate correlation but steep slope. But when there’s no correlation
the slope is always zero.
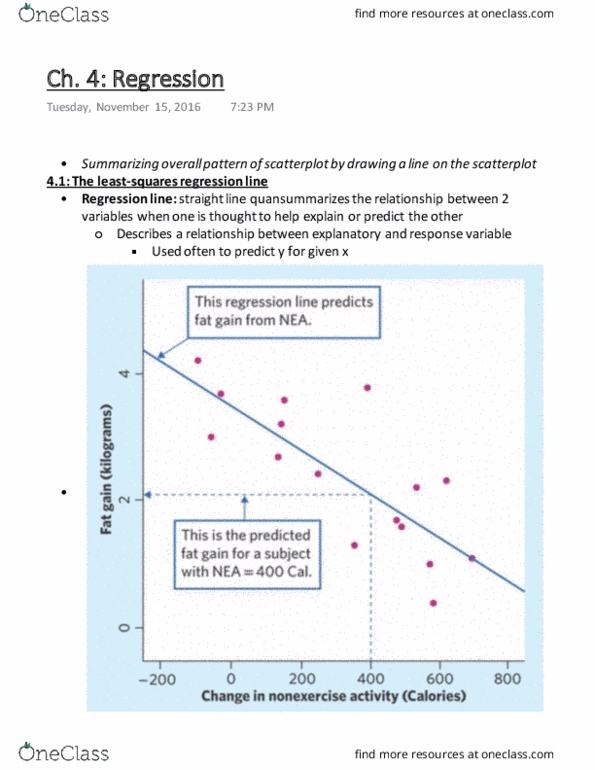
•For any given IQ score we can predict the Verbal score using the regression
line. But this will not be a perfect prediction:
•Regression model: Y = a + b X + (error)
•Error = vertical distance/divergence between a data point and the regression
line. Models with more error are models in which the data fall off the
regression line.
EXAMPLE OF PREDICTIONS:
•A child with an IQ of 100:
•Verbal = - 12 + 0.61 × (100) = - 12 + 61 = 49
•We know that all children with an IQ of 100 will NOT have a verbal score of 49.
•But, in the absence of any other information, 49 is our best prediction. Better than having nothing
at all.
•A child with an IQ of 120: Verbal = - 12 + 0.61 × (120) = 61.
•This is the same as the regression
equation from earlier. The y intercept is
the value the model takes when x = 0. B
is the slope associated with x.
•For any simple response time we can predict
the 4choice RT using the regression
line.
•Every single point will likely have
a different value of error associated.