COMM170 Lecture Notes - Lecture 3: Pie Chart, Scatter Plot, Categorical Variable


COMM170 Lecture Notes Thursday 16th March 2017
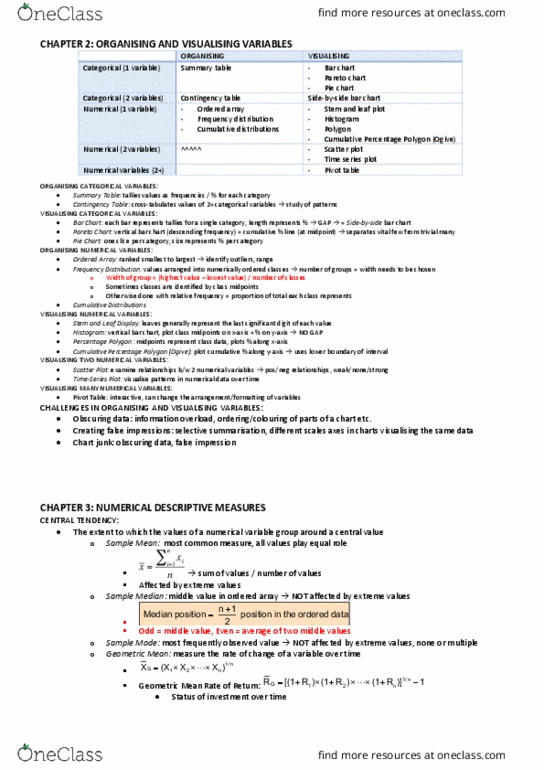
Types of Graphs
- Tallies in a table
- Tallies as a frequency table
- Line Graph
- Bar chart – horizontal
- Column graph – verticle
- Pie chart
- Stacked bar
- Scatter plot (definitely use in assessment)
- Stacked column graph
- Venn diagrams
Histogram vs Column Graph
- Depends on the data using.
- Gaps if the categories are separate (i.e. categorical data: countries names)
- No gaps if categories are numbers (i.e. 100, 150, 200). They are related so the
columns can touch
- Column graphs are used for categorical data
- Histograms are used for numerical data
Parts of a graph
- Title
- Y-axis title
- Y-axis units
- Y-axis
- X-axis title
- X-axis units
- X-axis
What is data?
- A collection of facts, numbers, words, measurements, observations or descriptions
- Data can be
o Qualitative – descriptive information
▪ i.e. what is your favourite colour?
o Quantitative - numerical information
▪ i.e. how many students are in the room
• Can be discrete – counted. can only take certain values
o i.e. species of animals. Cannot have 4.25 sheep.
• Can be continuous – measured. take a value within a range
o i.e. the temperature of the day over a certain number
of days. Temperature can be 21.5 or 28.2 or something
like that.
find more resources at oneclass.com
find more resources at oneclass.com