COMM170 Lecture Notes - Lecture 5: Longitudinal Study, Quartile


COMM170 Lecture Notes Thursday 30th March 2017
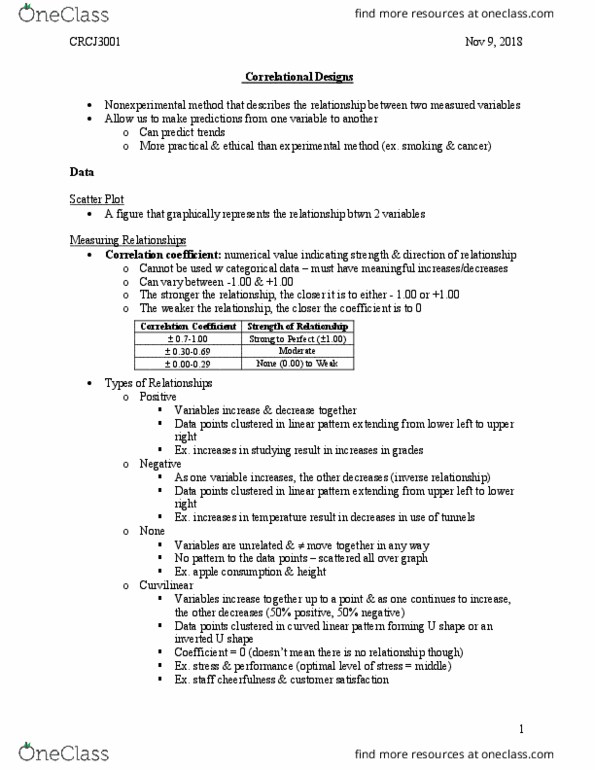
Correlation:
- There is a relation between the data
- Where two or more things are connected together
o i.e an increase in smoking happened with a decrease of illness
o or an increase in smoking happened with an increase of illness
- 4 types
o strong linear and positive
▪ all the points are forming a line going up
o weak linear and positive
▪ all the points are a bit scattered but still going up
o weak linear and negative
▪ all the points are a bit scattered and going down
o strong linear and negative
▪ all the points are forming a line going down
- No correlation is where the points just look random.
- There are non linear correlations
o Quadratic – curved in a v or u shape
o Exponential – a curved line
Pearson Correlation coefficient (r)
- Ranges from -1 (perfect negative correlation) through 0 (no correlation) to +1
(perfect positive correlation)
Confounders
- Confounders are reasons that might lie underneath the most obvious interpretation
of a correlation. i.e. two shopping centres could be busy on the same day in different
locations. It is raining in one but sunny in the other. Confounder is the shopping
centres could be busy because it is Christmas.
Correlation, Causation and Implication
- A correlation can imply but we do the inferring of a causation.
- Imply is to hint at something
- Infer is to make an educated guess.
What is changing over time?
- Take care as to hat hage is eig easured oer tie’
- Ask yourself: is the cohort the same over time?
- The data could be collected from different samples at each time period that is
graphed, or it could be showing changes in the same sample over time.
Longitudinal studies – studies that take place over long periods of time, i.e. decades,
measuring the same observations each time.
find more resources at oneclass.com
find more resources at oneclass.com
Document Summary
There is a relation between the data. Where two or more things are connected together i. e an increase in smoking happened with a decrease of illness: or an increase in smoking happened with an increase of illness. No correlation is where the points just look random. There are non linear correlations: quadratic curved in a v or u shape, exponential a curved line. Ranges from -1 (perfect negative correlation) through 0 (no correlation) to +1 (perfect positive correlation) Confounders are reasons that might lie underneath the most obvious interpretation of a correlation. i. e. two shopping centres could be busy on the same day in different locations. It is raining in one but sunny in the other. Confounder is the shopping centres could be busy because it is christmas. A correlation can imply but we do the inferring of a causation. Take care as to (cid:449)hat (cid:272)ha(cid:374)ge is (cid:271)ei(cid:374)g (cid:373)easured o(cid:448)er ti(cid:373)e".