PSYC206 Lecture Notes - Lecture 4: Analysis Of Variance, Effect Size, F-Test


Overview
!Review what we know about one-way between subjects ANOVA
!Effect size
!Follow-up tests
!One-way between subjects ANOVA for studies with
!one continuous DV (outcome)
!e.g., depression scores
!one categorical IV (predictor) that has
!more than two levels
!different people in each group
!e.g., antidepressant medication (placebo, low dose, high dose)
One-way between subjects ANOVA
!We compute an F ratio
!MSbetween/MSwithin
!Variability between groups contains the effect of our IV and other
extraneous factors
!Variability within groups contains just the extraneous factors
!larger F ratios indicate that the IV is having an effect on the DV
!The F ratio is significant if
!its larger than the critical F (hand calculations)
!the p value is < .05 (SPSS)
Summary table and formulas for between-subjects ANOVA
One-Way Between Subjects ANOVA
!A researcher is interested in looking at the effectiveness of a number
of treatments in treating depression
!No Treatment (NT)
!Cognitive Behaviour Therapy (CBT)
!Antidepressants (AD)
!Cognitive Behaviour Therapy and Antidepressants (CBTAD)
!After three months of treatment, levels of depression are assessed
using a depression scale (a high score indicates higher levels of depression)
Assumptions
!Data measured at interval or ratio level
!This refers to how you measured the DV (e.g., what type of scale did
you use to measure depression?)
!Independence of observations
!This refers to how you manipulated the IV (e.g., different people in
each group)
Assumptions
!Normality
!Scores on the DV are normally distributed within groups
!We'll always check/report this (Kolmogorov-Smirnov, Shapiro-Wilk)
!ANOVA appears to be robust to violations of normality when sample
sizes are large (i.e., > 30), so we can justify proceeding with caution even if
distributions are not normal when group sizes are large
Assumptions
!Homogeneity of variances
!Variances are the same in each group - how spread out the scores are
around the group mean
!We'll always check/report this (Levene's test)
!ANOVA is robust to violations of the homogeneity of variances
assumption when group sizes are equal
nonsignificant (p > .05): variances are equal; assumption met - what we
want
•
significant (p < .05): variances are not equal; assumption not met
• test difference between means with Welch or Brown-Forsythe
test instead of the F test
•
Assumptions met!
!Onto the actual ANOVA
ANOVA Summary Table
• 4groups(k=4)
5 people in each group (ni = 5) •
20 people total (N = 20) •
Source SS df MS F
Between 4-1 = 3
Within 20-4 = 16
Total 20-1 = 19
ANOVA Summary Table
Source SS df MS F
Between 370 3
Within 16
Total 19
ANOVA Summary Table
Source SS df MS F
Between 370 3
Within 128 16
Total Can add the two above together to get
SStotal
19
Can figure out how SS total by below
ANOVA Summary Table
Source SS df MS F
Between 370 3
Within 128 16
Total 498 19
ANOVA Summary Table
Source SS df MS F
Between 370 3 370/3=123.33
Within 128 16
Total 498 19
ANOVA Summary Table
Source SS df MS F
Between 370 3 123.33
Within 128 16 128/16=8
Total 498 19
ANOVA Summary Table
Source SS df MS F
Between 370 3 123.33 123.33/8=15.42
Within 128 16 8
Total 498 19
ANOVA Summary Table
Numerator df
Source SS df MS F
Between 370 3 123.33 15.42
Within 128 16 8
Total 498 19
Denominator df
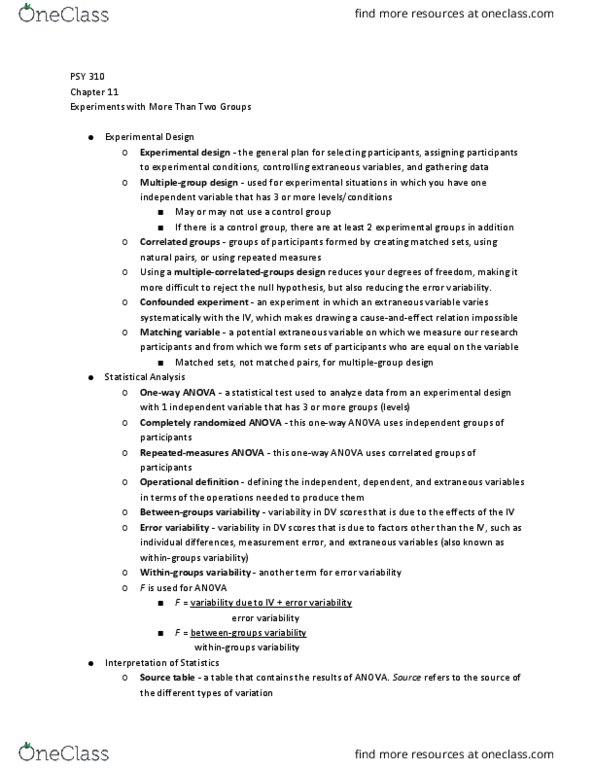
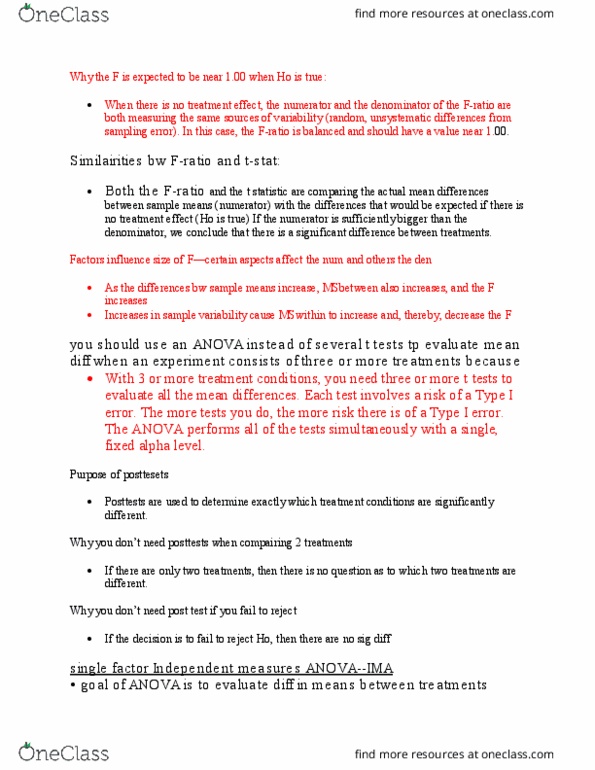
Need to look up our critical F
F Distribution Critical Values
ANOVA Summary Table
Source SS df MS F
Between 370 3 123.33 15.42
Within 128 16 8
Total 498 19
A one-way between subjects ANOVA revealed that treatment condition had a
significant effect on depression scores, F(3, 16) = 15.42, p < .05.
ANOVA Using SPSS
A one-way between subjects ANOVA revealed that treatment condition had a
significant effect on depression scores, F(3, 16) = 15.42, p < .001.
ANOVA and t-tests
!When evaluating the difference between two means from a
between subjects design with only two conditions, you can use either an
independent samples t-test or a one-way between subjects ANOVA
!Same assumptions
!Both result in the same statistical decision (p value)
!The t-statistic is based on differences and the F-ratio is based on
squared differences
!The F ratio is simply the t value squared
Measuring Effect Size
!ANOVA evaluates the significance of the sample mean differences
!are the differences bigger than would be reasonable to expect just by
chance?
!With large samples, it is possible for relatively small mean differences to be
statistically significant
!the hypothesis test does not necessarily provide information about the
actual size of the mean differences
!It is helpful to calculate a measure of effect size
!percentage of variance that is accounted for by the treatment effects
Measuring Effect Size
!The percentage of variance in the DV that is explained by the IV is identified
as η2 (eta squared)
!The formula for computing effect size is η2 = SSbetween/SStotal
!Note: this is not the same as the F ratio
!That formula is F = MSbetween/MSwithin
Conclusions
!What can we conclude?
!There is evidence to suggest that the four treatment programs differ in their
effectiveness in treating depression, F(3, 16) = 15.42, p < .001, η2 = .74.
Follow-Up Tests
Follow-Up Tests
!The advantage of ANOVA is it allows us to compare more than two
conditions
!compares all means simultaneously in a single hypothesis test
!A significant F means that one or more of the differences between group
means is statistically significant
!doesn't indicate which means are significantly different
Follow-Up Tests
!If you have a significant F value and more than two groups, you need to
conduct follow-up tests
!additional analyses to determine exactly which mean differences are
significant
!involves a series of tests, each with a risk of a Type 1 error
!Each comparison or contrast compares two chunks of information
!Group A vs. Group B
!Group A vs. (average of Groups B, C, D)
Controlling the Type I Error Rate
!Experimentwise (familywise)
!the probability of making a Type I error across a family of tests
!the 'family' is a set of tests that are conducted on the same data set
!Decisionwise
!the probability of making a Type I error on a single statistical test
!there are some instances when it is acceptable to hold the
decisionwise error rate at 0.05 when we are performing a set of tests on
the same data set (e.g., planned orthogonal contrasts)
Planned and Unplanned Comparisons
Planned Unplanned
!Hypothesis driven
!We decide which comparisons we want to make before inspecting
the data
Unplanned
!Not hypothesis driven
!We decide the make these comparisons after inspecting the data
!Need to be careful about capitalising on chance findings
Orthogonal and Non-orthogonal Contrasts
Orthogonal
!Orthogonal contrasts are statistically independent
!the resulting test statistics and p-values will not be correlated
!Ok to use decisionwise error rate of 0.05 for each contrast
Non-orthogonal
!Non-orthogonal contrasts are related somehow
!group A vs. B; group A vs. C
!singling out group A twice
!the resulting test statistics and p-values will be correlated to some extent
!need to use a more conservative probability level, in order to ensure that
the experimentwise error rate remains at .05
Planned Complex Contrasts
Breaking down the between subjects variance according to hypotheses made a
priori (before the experiment)
Hypothesis 1: The three treatment programs will be significantly more effective
in treating depression than no treatment
Hypothesis 2: The CBTAD treatment program will be more effective in treating
depression than the CBT and AD in isolation
Hypothesis 3: There will be no difference in the effectiveness of CBT and AD
when presented in isolation
Contrasts
!To do contrasts, we have to set coefficients for the different groups
!We need to follow certain rules
!We compare two chunks of information per contrast
!We can leave groups out by assigning a weight of 0
!One chunk has positive coefficients, one chunk has negative
coefficients
!The weights assigned to the group(s) in one chunk should be equal
to the number of groups in the other chunk
!The sum of the coefficients for a contrast should equal zero
Assigning Coefficients
Assigning Coefficients
Assigning Coefficients
Value of the Contrast
!Once we have decided on our coefficients, we then need to calculate the
value of the contrast (or contrast estimate)
!We do this by multiplying each coefficient by its respective mean and
summing them together
Value of the Contrast
!Once we have decided on our coefficients, we then need to calculate the
value of the contrast (or contrast estimate)
!We do this by multiplying each coefficient by its respective mean and
summing them together
NT CBT AD CBTAD
Contrast 1 +3 -1 -1 -1
Contrast 2 0 +1 +1 -2
Contrast 3 0 +1 -1 0
Mean 15 10 8 3
Contrast 2: (0x15) + (1x10) + (1x8) + (-2x3) = 0 + 10 + 8 – 6
= 12
Value of the Contrast
!Once we have decided on our coefficients, we then need to calculate the
value of the contrast (or contrast estimate)
!We do this by multiplying each coefficient by its respective mean and
summing them together
NT CBT AD CBTAD
Contrast 1 +3 -1 -1 -1
Contrast 2 0 +1 +1 -2
Contrast 3 0 +1 -1 0
Mean 15 10 8 3
Contrast 3: (0x15) + (1x10) + (-1x8) + (0x3) = 0 + 10 – 8 + 0
=2
Complex Comparisons in SPSS
Complex Comparisons in SPSS
Note that the value of the contrast matches our calculations •
We also get a t test for it with a p value •
Tells us whether that particular contrast is significant •
Recall that higher scores indicate higher levels of depression in this study •
Look at the significance level and the means for the relevant chunks in the
contrast
•
On average, the three treatment programs were significantly more
effective in reducing
•
depression than no treatment, t(16) = 5.48, p < .001.
Complex Comparisons in SPSS
• On average, CBT and AD treatments when presented in isolation, were less
effective in reducing depression than a combination of CBT and AD, t(16) = 3.87,
p = .001.
Complex Comparisons in SPSS
• There was no significant difference in the effectiveness of CBT and AD in
treating depression when presented in isolation, t(16) = 1.12, p = .280.
Orthogonal Contrasts
!The contrasts we just did are orthogonal
!For a group of contrasts to be orthogonal we have to follow all the earlier
rules for setting up our coefficients and also these
!If a group is singled out in one contrast, it must be excluded from any
subsequent contrasts
!The number of contrasts should be equal to the dfbetween
!Number of groups -1
!For each possible pair of contrasts, when we multiply the coefficients
for each group and then add them up, we get zero
Checking Orthogonality
!For each possible pair of contrasts, when we multiply the coefficients for
each group and then add them up, we get zero
NT CBT AD CBT&AD
Contrast 1 +3 -1 -1 -1
Contrast 2 0 +1 +1 -2
Contrast 3 0 +1 -1 0
Orthogonality
NT CBT AD CBT&AD
Contrast 1 +3 -1 -1 -1
Contrast 2 0 +1 +1 -2
0 -1 -1 +2 0
NT CBT AD CBT&AD
Contrast 1 +3 -1 -1 -1
Contrast 3 0 +1 -1 0
0 -1 +1 0 0
Orthogonality
NT CBT AD CBT&AD
Contrast 2 0 +1 +1 -2
Contrast 3 0 +1 -1 0
0 +1 -1 0 0
Pairwise Comparisons
!a comparison of individual conditions two at a time
• LSD = least significant difference
Uses a decisionwise alpha of .05 for each test •
No consideration of familywise error•
• Bonferroni
controls the familywise error •
The p value it gives you is the LSD one multiplied by
the number of unique comparisons
•
• Tukey
controls the familywise error •
computes a single value that determines the minimum
difference between means that is necessary for
significance (Honestly Significant Difference)
•
any group differences greater than this value are
significant
•
can only be used when the group sample sizes are
equal
•
• Scheffe
controls the familywise error •
uses a more stringent critical F from the overall
ANOVA to evaluate each comparison
•
more conservative; good for unplanned comparisons •
What type of follow-up test should I do?
!Planned before looking at the data (a prior)
!Orthogonal contrasts
!Canuseadecisionwisealphaof.05becauseeachcontrastisstatistically
independent from the other contrasts
!Nonorthogonal contrasts or pairwise comparisons
!Bonferroni correction to control familywise error
!Corrects p value (or alpha) based on the number of
comparisons you make
!Unplanned
!Tukeys HSD if we have equal numbers of participants in each group
!Controls familywise error by calculating the difference needed for
an honestly significant difference
! Scheffeì
!Most conservative/cautious method of controlling familywise
error involving an adjusted critical F for each comparison
PUT THIS IN THE EXAM CHEAT SHEET
Want it to be nonsignifcant so the distribution is normal
-9 6x6 36x5
-15 0x0
-10
-8
5x5
0x0
-3 -3x-3
Lecture Week 4
Thursday, 22 March 2018
3:12 PM

Overview
!Review what we know about one-way between subjects ANOVA
!Effect size
!Follow-up tests
!One-way between subjects ANOVA for studies with
!one continuous DV (outcome)
!e.g., depression scores
!one categorical IV (predictor) that has
!more than two levels
!different people in each group
!e.g., antidepressant medication (placebo, low dose, high dose)
One-way between subjects ANOVA
!We compute an F ratio
!MSbetween/MSwithin
!Variability between groups contains the effect of our IV and other
extraneous factors
!Variability within groups contains just the extraneous factors
!larger F ratios indicate that the IV is having an effect on the DV
!The F ratio is significant if
!its larger than the critical F (hand calculations)
!the p value is < .05 (SPSS)
Summary table and formulas for between-subjects ANOVA
One-Way Between Subjects ANOVA
!A researcher is interested in looking at the effectiveness of a number
of treatments in treating depression
!No Treatment (NT)
!Cognitive Behaviour Therapy (CBT)
!Antidepressants (AD)
!Cognitive Behaviour Therapy and Antidepressants (CBTAD)
!After three months of treatment, levels of depression are assessed
using a depression scale (a high score indicates higher levels of depression)
Assumptions
!Data measured at interval or ratio level
!This refers to how you measured the DV (e.g., what type of scale did
you use to measure depression?)
!Independence of observations
!This refers to how you manipulated the IV (e.g., different people in
each group)
Assumptions
!Normality
!Scores on the DV are normally distributed within groups
!We'll always check/report this (Kolmogorov-Smirnov, Shapiro-Wilk)
!ANOVA appears to be robust to violations of normality when sample
sizes are large (i.e., > 30), so we can justify proceeding with caution even if
distributions are not normal when group sizes are large
Assumptions
!Homogeneity of variances
!Variances are the same in each group - how spread out the scores are
around the group mean
!We'll always check/report this (Levene's test)
!ANOVA is robust to violations of the homogeneity of variances
assumption when group sizes are equal
nonsignificant (p > .05): variances are equal; assumption met - what we
want
•
significant (p < .05): variances are not equal; assumption not met
• test difference between means with Welch or Brown-Forsythe
test instead of the F test
•
Assumptions met!
!Onto the actual ANOVA
ANOVA Summary Table
• 4groups(k=4)
5 people in each group (ni = 5) •
20 people total (N = 20) •
Source SS df MS F
Between 4-1 = 3
Within 20-4 = 16
Total 20-1 = 19
ANOVA Summary Table
Source SS df MS F
Between 370 3
Within 16
Total 19
ANOVA Summary Table
Source SS df MS F
Between 370 3
Within 128 16
Total Can add the two above together to get
SStotal
19
Can figure out how SS total by below
ANOVA Summary Table
Source SS df MS F
Between 370 3
Within 128 16
Total 498 19
ANOVA Summary Table
Source SS df MS F
Between 370 3 370/3=123.33
Within 128 16
Total 498 19
ANOVA Summary Table
Source SS df MS F
Between 370 3 123.33
Within 128 16 128/16=8
Total 498 19
ANOVA Summary Table
Source SS df MS F
Between 370 3 123.33 123.33/8=15.42
Within 128 16 8
Total 498 19
ANOVA Summary Table
Numerator df
Source SS df MS F
Between 370 3 123.33 15.42
Within 128 16 8
Total 498 19
Denominator df
Need to look up our critical F
F Distribution Critical Values
ANOVA Summary Table
Source SS df MS F
Between 370 3 123.33 15.42
Within 128 16 8
Total 498 19
A one-way between subjects ANOVA revealed that treatment condition had a
significant effect on depression scores, F(3, 16) = 15.42, p < .05.
ANOVA Using SPSS
A one-way between subjects ANOVA revealed that treatment condition had a
significant effect on depression scores, F(3, 16) = 15.42, p < .001.
ANOVA and t-tests
!When evaluating the difference between two means from a
between subjects design with only two conditions, you can use either an
independent samples t-test or a one-way between subjects ANOVA
!Same assumptions
!Both result in the same statistical decision (p value)
!The t-statistic is based on differences and the F-ratio is based on
squared differences
!The F ratio is simply the t value squared
Measuring Effect Size
!ANOVA evaluates the significance of the sample mean differences
!are the differences bigger than would be reasonable to expect just by
chance?
!With large samples, it is possible for relatively small mean differences to be
statistically significant
!the hypothesis test does not necessarily provide information about the
actual size of the mean differences
!It is helpful to calculate a measure of effect size
!percentage of variance that is accounted for by the treatment effects
Measuring Effect Size
!The percentage of variance in the DV that is explained by the IV is identified
as η2 (eta squared)
!The formula for computing effect size is η2 = SSbetween/SStotal
!Note: this is not the same as the F ratio
!That formula is F = MSbetween/MSwithin
Conclusions
!What can we conclude?
!There is evidence to suggest that the four treatment programs differ in their
effectiveness in treating depression, F(3, 16) = 15.42, p < .001, η2 = .74.
Follow-Up Tests
Follow-Up Tests
!The advantage of ANOVA is it allows us to compare more than two
conditions
!compares all means simultaneously in a single hypothesis test
!A significant F means that one or more of the differences between group
means is statistically significant
!doesn't indicate which means are significantly different
Follow-Up Tests
!If you have a significant F value and more than two groups, you need to
conduct follow-up tests
!additional analyses to determine exactly which mean differences are
significant
!involves a series of tests, each with a risk of a Type 1 error
!Each comparison or contrast compares two chunks of information
!Group A vs. Group B
!Group A vs. (average of Groups B, C, D)
Controlling the Type I Error Rate
!Experimentwise (familywise)
!the probability of making a Type I error across a family of tests
!the 'family' is a set of tests that are conducted on the same data set
!Decisionwise
!the probability of making a Type I error on a single statistical test
!there are some instances when it is acceptable to hold the
decisionwise error rate at 0.05 when we are performing a set of tests on
the same data set (e.g., planned orthogonal contrasts)
Planned and Unplanned Comparisons
Planned Unplanned
!Hypothesis driven
!We decide which comparisons we want to make before inspecting
the data
Unplanned
!Not hypothesis driven
!We decide the make these comparisons after inspecting the data
!Need to be careful about capitalising on chance findings
Orthogonal and Non-orthogonal Contrasts
Orthogonal
!Orthogonal contrasts are statistically independent
!the resulting test statistics and p-values will not be correlated
!Ok to use decisionwise error rate of 0.05 for each contrast
Non-orthogonal
!Non-orthogonal contrasts are related somehow
!group A vs. B; group A vs. C
!singling out group A twice
!the resulting test statistics and p-values will be correlated to some extent
!need to use a more conservative probability level, in order to ensure that
the experimentwise error rate remains at .05
Planned Complex Contrasts
Breaking down the between subjects variance according to hypotheses made a
priori (before the experiment)
Hypothesis 1: The three treatment programs will be significantly more effective
in treating depression than no treatment
Hypothesis 2: The CBTAD treatment program will be more effective in treating
depression than the CBT and AD in isolation
Hypothesis 3: There will be no difference in the effectiveness of CBT and AD
when presented in isolation
Contrasts
!To do contrasts, we have to set coefficients for the different groups
!We need to follow certain rules
!We compare two chunks of information per contrast
!We can leave groups out by assigning a weight of 0
!One chunk has positive coefficients, one chunk has negative
coefficients
!The weights assigned to the group(s) in one chunk should be equal
to the number of groups in the other chunk
!The sum of the coefficients for a contrast should equal zero
Assigning Coefficients
Assigning Coefficients
Assigning Coefficients
Value of the Contrast
!Once we have decided on our coefficients, we then need to calculate the
value of the contrast (or contrast estimate)
!We do this by multiplying each coefficient by its respective mean and
summing them together
Value of the Contrast
!Once we have decided on our coefficients, we then need to calculate the
value of the contrast (or contrast estimate)
!We do this by multiplying each coefficient by its respective mean and
summing them together
NT CBT AD CBTAD
Contrast 1 +3 -1 -1 -1
Contrast 2 0 +1 +1 -2
Contrast 3 0 +1 -1 0
Mean 15 10 8 3
Contrast 2: (0x15) + (1x10) + (1x8) + (-2x3) = 0 + 10 + 8 – 6
= 12
Value of the Contrast
!Once we have decided on our coefficients, we then need to calculate the
value of the contrast (or contrast estimate)
!We do this by multiplying each coefficient by its respective mean and
summing them together
NT CBT AD CBTAD
Contrast 1 +3 -1 -1 -1
Contrast 2 0 +1 +1 -2
Contrast 3 0 +1 -1 0
Mean 15 10 8 3
Contrast 3: (0x15) + (1x10) + (-1x8) + (0x3) = 0 + 10 – 8 + 0
=2
Complex Comparisons in SPSS
Complex Comparisons in SPSS
Note that the value of the contrast matches our calculations •
We also get a t test for it with a p value •
Tells us whether that particular contrast is significant •
Recall that higher scores indicate higher levels of depression in this study •
Look at the significance level and the means for the relevant chunks in the
contrast
•
On average, the three treatment programs were significantly more
effective in reducing
•
depression than no treatment, t(16) = 5.48, p < .001.
Complex Comparisons in SPSS
• On average, CBT and AD treatments when presented in isolation, were less
effective in reducing depression than a combination of CBT and AD, t(16) = 3.87,
p = .001.
Complex Comparisons in SPSS
• There was no significant difference in the effectiveness of CBT and AD in
treating depression when presented in isolation, t(16) = 1.12, p = .280.
Orthogonal Contrasts
!The contrasts we just did are orthogonal
!For a group of contrasts to be orthogonal we have to follow all the earlier
rules for setting up our coefficients and also these
!If a group is singled out in one contrast, it must be excluded from any
subsequent contrasts
!The number of contrasts should be equal to the dfbetween
!Number of groups -1
!For each possible pair of contrasts, when we multiply the coefficients
for each group and then add them up, we get zero
Checking Orthogonality
!For each possible pair of contrasts, when we multiply the coefficients for
each group and then add them up, we get zero
NT CBT AD CBT&AD
Contrast 1 +3 -1 -1 -1
Contrast 2 0 +1 +1 -2
Contrast 3 0 +1 -1 0
Orthogonality
NT CBT AD CBT&AD
Contrast 1 +3 -1 -1 -1
Contrast 2 0 +1 +1 -2
0 -1 -1 +2 0
NT CBT AD CBT&AD
Contrast 1 +3 -1 -1 -1
Contrast 3 0 +1 -1 0
0 -1 +1 0 0
Orthogonality
NT CBT AD CBT&AD
Contrast 2 0 +1 +1 -2
Contrast 3 0 +1 -1 0
0 +1 -1 0 0
Pairwise Comparisons
!a comparison of individual conditions two at a time
• LSD = least significant difference
Uses a decisionwise alpha of .05 for each test •
No consideration of familywise error•
• Bonferroni
controls the familywise error •
The p value it gives you is the LSD one multiplied by
the number of unique comparisons
•
• Tukey
controls the familywise error •
computes a single value that determines the minimum
difference between means that is necessary for
significance (Honestly Significant Difference)
•
any group differences greater than this value are
significant
•
can only be used when the group sample sizes are
equal
•
• Scheffe
controls the familywise error •
uses a more stringent critical F from the overall
ANOVA to evaluate each comparison
•
more conservative; good for unplanned comparisons •
What type of follow-up test should I do?
!Planned before looking at the data (a prior)
!Orthogonal contrasts
!Canuseadecisionwisealphaof.05becauseeachcontrastisstatistically
independent from the other contrasts
!Nonorthogonal contrasts or pairwise comparisons
!Bonferroni correction to control familywise error
!Corrects p value (or alpha) based on the number of
comparisons you make
!Unplanned
!Tukeys HSD if we have equal numbers of participants in each group
!Controls familywise error by calculating the difference needed for
an honestly significant difference
! Scheffeì
!Most conservative/cautious method of controlling familywise
error involving an adjusted critical F for each comparison
PUT THIS IN THE EXAM CHEAT SHEET
Want it to be nonsignifcant so the distribution is normal
-9 6x6 36x5
-15 0x0
-10
-8
5x5
0x0
-3 -3x-3
Lecture Week 4
Thursday, 22 March 2018 3:12 PM
Document Summary
Review what we know about one-way between subjects anova. One-way between subjects anova for studies with. E. g. , antidepressant medication (placebo, low dose, high dose) Variability between groups contains the effect of our iv and other extraneous factors. Variability within groups contains just the extraneous factors larger f ratios indicate that the iv is having an effect on the dv. Its larger than the critical f (hand calculations) The p value is < . 05 (spss) A researcher is interested in looking at the effectiveness of a number of treatments in treating depression. After three months of treatment, levels of depression are assessed using a depression scale (a high score indicates higher levels of depression) Data measured at interval or ratio level. This refers to how you measured the dv (e. g. , what type of scale did you use to measure depression?) This refers to how you manipulated the iv (e. g. , different people in each group)