STAT1008 Lecture Notes - Lecture 2: Scatter Plot, Lincoln Near-Earth Asteroid Research, Dependent And Independent Variables


2.6 TWO QUANTITATIVE VARIABLES: LINEAR REGRESSION
Crickets and Temperature
- Can you estimate the temperature on a summer evening, just be listening to crickets chirp?
Regression Line
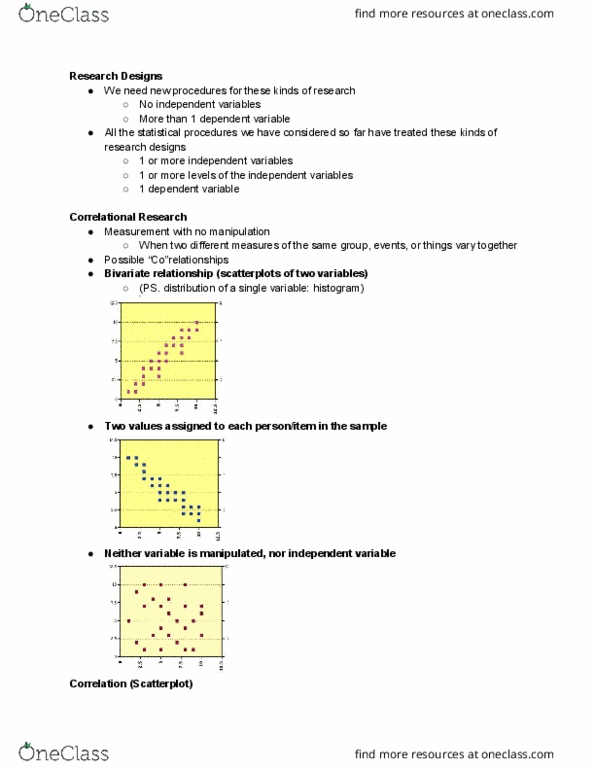
- Goal: Find a straight line that best fits the data in a scatterplot
Equation of the Line
- The estimated regression line is
Prediction
- The regression equation can be used to predict y for a given value of x
o Temp = 37.7 + 0.23Chirps
- If you listen and hear crickets chirping about 140 times per minute, your best guess at the outside
temperature is
o 37.7 + 0.23 . 140 = 69.9℉
o What is the predicted temperature when the crickets do 103 chirps per minute? 37.7 + 0.23
2 140 = 69.9℉
- The predicted response is on the regression line directly above the x value
find more resources at oneclass.com
find more resources at oneclass.com

- One of the cases in the cricket dataset is 103 chirps per minute and 63.5oF
- How far is the predicted temperature from the observed temperature for this case?
Regression Line
- How do we find the best fitting line?
Predicted and Actual Values
- The observed response value, y, is the response value observed for a particular data point
- The predicted response value, y-hat, is the response value that would be predicted for a given x value,
based on a model
- The best fitting line is that which makes the predicted values closest to the actual values
find more resources at oneclass.com
find more resources at oneclass.com
Document Summary
Goal: find a straight line that best fits the data in a scatterplot. The regression equation can be used to predict y for a given value of x: temp = 37. 7 + 0. 23chirps. The predicted response is on the regression line directly above the x value. One of the cases in the cricket dataset is 103 chirps per minute and 63. 5of. The observed response value, y, is the response value observed for a particular data point. The predicted response value, y-hat, is the response value that would be predicted for a given x value, based on a model. The best fitting line is that which makes the predicted values closest to the actual values. Want to make all the residuals as small as possible. Rely on technology for this finding the least square line. (cid:862)least s(cid:395)ua(cid:396)es li(cid:374)e(cid:863) = (cid:862)(cid:396)eg(cid:396)essio(cid:374) li(cid:374)e(cid:863) Least squares line is the line which minimizes the sum of squared residuals.