1305AFE Lecture Notes - Lecture 3: Car Rental, Data Set, Squared Deviations From The Mean


Week 3 Business Data Analysis Lecture Notes
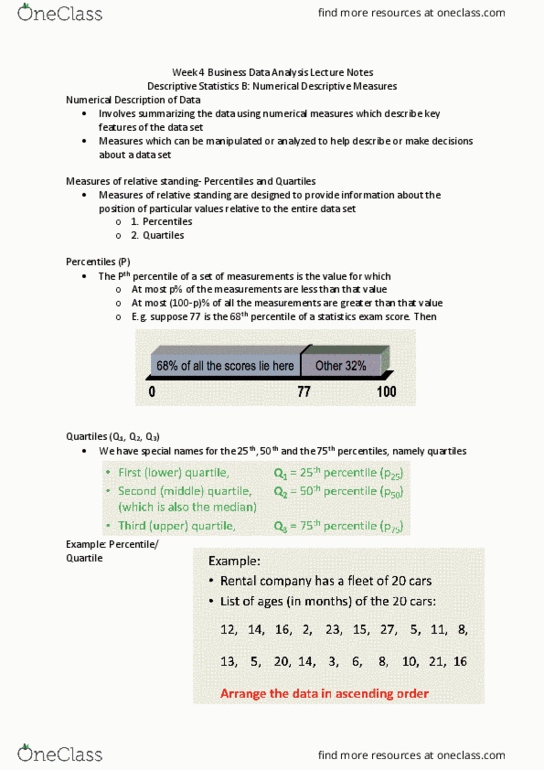
Descriptive Statistics B: Numerical Descriptive Measures
Numerical Description of Data
• Involves summarizing the data using numerical measures which describe key
features of the data set such as the center of the data set and dispersion of the data
set (or variability)
• Measures which can be manipulated or analyzed to help describe or make decisions
about a data set
Numerical techniques- objectives
1. Measures of central location → Mean, Median, Mode
2. Measures of Variability→ Range, Standard deviation, Variance, Coefficient of
variation
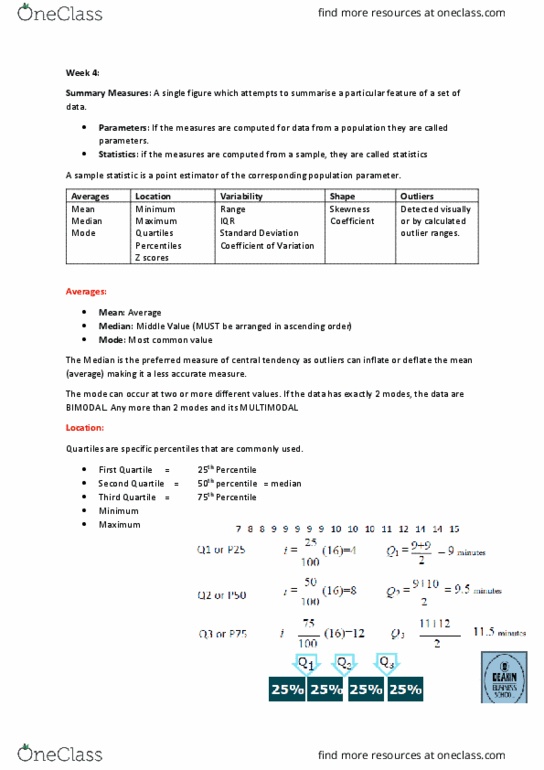
3. Measures of relative standing → Percentiles, Quartiles
4. Measures of linear relationship → Covariance, Correlation, Coefficient of
determination, least squares regression line
Descriptive Statistics Relating to a Population
• A rental company has a fleet of 21 cars
• Data in this case represents a population
• List of ages (in month) of 21 cars:
o Data set 1
▪ 12,12,17,2,23,15,27,5,11,8,13,5,20,14,3,17,8,10,21,16,13
▪ Smallest= 2 Largest=27
Population Mean (µ)
• The mean (average) is the most popular and useful measure of central location
• iterpretatio: the aerage age of the ars of the opa’s fleet is oths
• the mean age of 13 months is a reasonable representative value of the whole data
set
• Advantages:
o Well known
o Uses all information
o Easy to calculate
• Disadvantages
o Adversely affected by extreme observations
find more resources at oneclass.com
find more resources at oneclass.com

Car Rental Company
• If the car rental company decides to add on old Porsche to their stock. The Porsche is
255-month-old:
• Data set 2
o 12,13,17,2,23,15,27,5,11,8,13,5,20,14,3,17,8,10,21,16,13,255
• What is the new mean (average) age? 24 months
• The age of old Porsche is an outlier of the data set. As a result, the mean shifted
(almost doubles) from 13 to 24 and 24 is not a reasonable representative value of
the whole data set
Population Median- Me
• Middle value when the observations are arranged in as ascending order
o Data set 1
▪ 2,3,5,5,8,8,10,11,12,13,13,13,14,15,16,17,20,21,23,27
o Me= Middles value of the data set
o In this case, N= 21 and the middle location is 11
o Me = 13 months
o Interpretation: half the cars are 13 months or younger
o Middles
• Middles value when the observations are arranged in an ascending order
o Data set 2
▪ 2,3,5,5,8,8,10,11,12,13,13,13,14,15,16,17,20,21,23,27,255
o In this case, N=22 and hence the average of 11th and 12th observations
o Me = average of the two middles values of the data set
o Me= +
=13 ℎ
o Interpretation: half the cars are 13 months or younger
• Advantages:
o Easy to calculate
o Not affected by extreme observations
• Disadvantages:
o Does not use all information
Population Mode- Mo
• The values of the most frequently occurring observation(s)
• Data set 1
o 12,13,17,2,23,15,27,5,11,8,13,5,20,14,3,17,8,10,21,16,13
o Mode of this data set is 13
o Interpretation: the most repeated age for the 21 cars is 13 months
• The advantages and disadvantages for the mode are similar to the median
find more resources at oneclass.com
find more resources at oneclass.com

Relationship between Mean, Median and Mode
• If a distribution is symmetrical, the mean, median and mode coincide
• If a distribution is not symmetrical, and skewed to the right (positively skewed), the
three measures differ.
o Example: Australian family wealth
• If a distribution is not symmetrical, and skewed to the left (negatively skewed), the
three measure differ
o Example: Australian age at death
find more resources at oneclass.com
find more resources at oneclass.com
Document Summary
Descriptive statistics relating to a population: a rental company has a fleet of 21 cars, data in this case represents a population, list of ages (in month) of 21 cars, data set 1, 12,12,17,2,23,15,27,5,11,8,13,5,20,14,3,17,8,10,21,16,13, smallest= 2 largest=27. If the car rental company decides to add on old porsche to their stock. 24 months: the age of old porsche is an outlier of the data set. As a result, the mean shifted (almost doubles) from 13 to 24 and 24 is not a reasonable representative value of the whole data set. Population median- me: middle value when the observations are arranged in as ascending order, data set 1, 2,3,5,5,8,8,10,11,12,13,13,13,14,15,16,17,20,21,23,27, me= middles value of the data set. In this case, n= 21 and the middle location is 11: me = 13 months. Interpretation: half the cars are 13 months or younger: middles, middles value when the observations are arranged in an ascending order, data set 2, 2,3,5,5,8,8,10,11,12,13,13,13,14,15,16,17,20,21,23,27,255.