1305AFE Lecture Notes - Lecture 4: Scatter Plot, Squared Deviations From The Mean, Interquartile Range


Week 4 Business Data Analysis Lecture Notes
Descriptive Statistics B: Numerical Descriptive Measures
Numerical Description of Data
• Involves summarizing the data using numerical measures which describe key
features of the data set
• Measures which can be manipulated or analyzed to help describe or make decisions
about a data set
Measures of relative standing- Percentiles and Quartiles
• Measures of relative standing are designed to provide information about the
position of particular values relative to the entire data set
o 1. Percentiles
o 2. Quartiles
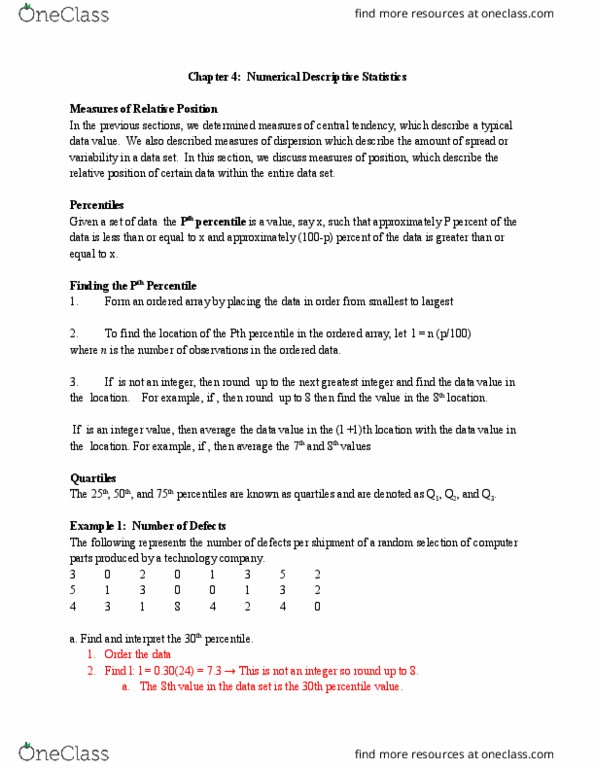
Percentiles (P)
• The Pth percentile of a set of measurements is the value for which
o At most p% of the measurements are less than that value
o At most (100-p)% of all the measurements are greater than that value
o E.g. suppose 77 is the 68th percentile of a statistics exam score. Then
Quartiles (Q1, Q2, Q3)
• We have special names for the 25th, 50th and the 75th percentiles, namely quartiles
Example: Percentile/
Quartile
find more resources at oneclass.com
find more resources at oneclass.com

find more resources at oneclass.com
find more resources at oneclass.com

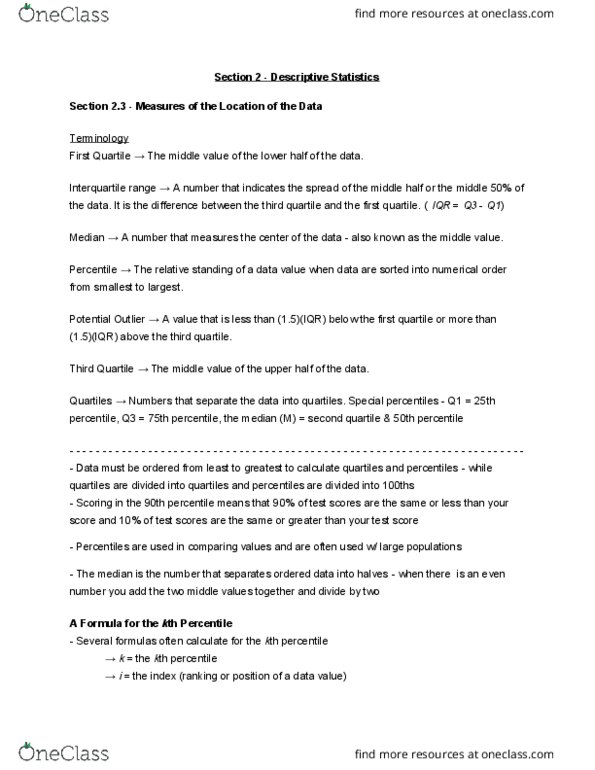
Interquartile Range (IR)
• Range from First to Third Quartile or the range of the middle 50% of the data
• Central or important data
• Not affected by extremes
• Q3=16, Q1= 6.5
• IR=Q3-Q1= 16-6.5=9.5
• Interpretation: the age of the middle 50% of the cars are spread over 9.5 months
find more resources at oneclass.com
find more resources at oneclass.com
Document Summary
Involves summarizing the data using numerical measures which describe key features of the data set: measures which can be manipulated or analyzed to help describe or make decisions about a data set. Measures of relative standing- percentiles and quartiles: measures of relative standing are designed to provide information about the position of particular values relative to the entire data set, 1. Quartiles (q1, q2, q3: we have special names for the 25th, 50th and the 75th percentiles, namely quartiles. Interquartile range (ir: range from first to third quartile or the range of the middle 50% of the data, central or important data, not affected by extremes, q3=16, q1= 6. 5. Interpretation: the age of the middle 50% of the cars are spread over 9. 5 months. Example- sample data: a sample of size 5 is randomly selected from the population and the ages of the cars (already arranged) are: