1305AFE Lecture Notes - Lecture 6: Random Variable, Central Limit Theorem, Quality Control


Week 6 Business Data Analysis Lecture Notes
Introduction to Statistical Inference
Statistical Inference
• Whenever a sample is selected to either learn something about, or draw conclusions
regarding a larger group of items (Population)
Examples:
• The QLD government may sample a number of people in QLD to gauge the level of
support of reintroducing daylight saving in QLD
• A firm may conduct tests on a piece of machinery to determine if it is working
according to specifications
Types of Statistical Inference
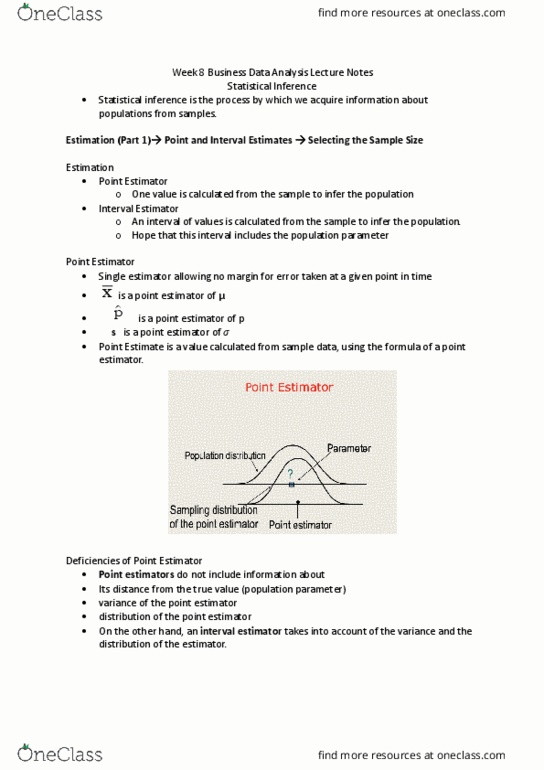
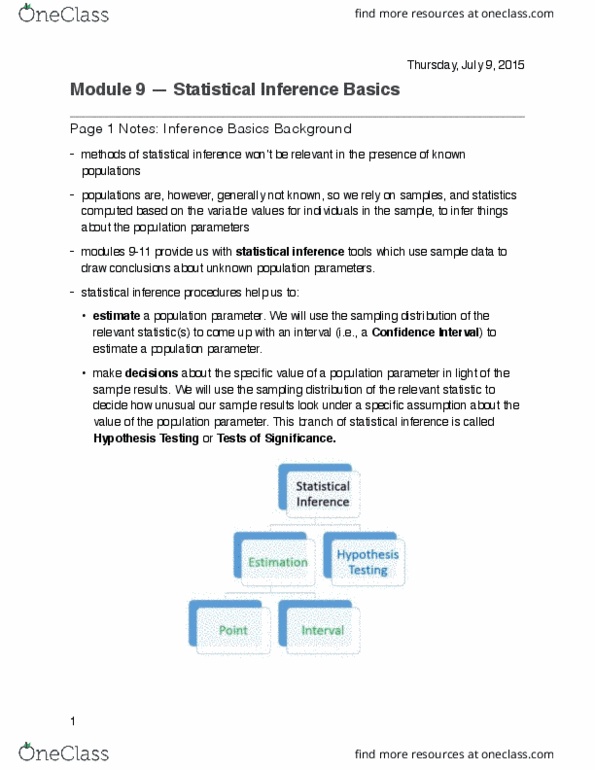
• Estimation
o Where a sample is selected and a statistic calculated in order to try and learn
the real value of some unknown parameter
▪ E.g. what is the level of support from people in QLD for reintroducing
daylight saving in QLD?
• Hypothesis Testing
o Where a sample is selected to test an already known or supposed value of a
population parameter
▪ A machine may be designed to fill bottles with 600mls of fluid. The
manufacturer needs to regularly test the machine to make sure that it
is filling correctly
Question:
• If we calculate a statistic from a sample, will it exactly represent the population
parameter (population value) we are interested in?
o SAMPLING ERROR
• If not then:
o Will the sample statistic underestimate or overestimate the population
parameter?
o How large will any error be?
o Is it likely that the error will be small enough that the sample statistic will be
useful?
• We need to know something about the possible range of errors, and the likely size of
errors
find more resources at oneclass.com
find more resources at oneclass.com

Sampling Distributions
• A sampling distribution is the distribution of possible values any sample statistic may
take or spread around the population parameter of interest
• The sampling distribution also takes account of the distribution of possible sampling
errors
Sampling distribution
• Every sample statistic calculated is a random variable
• Every random variable will have a distribution
• If we can define the distribution then we can use it to answer questions such as that
posed by the bottling process example
Sampling distribution of sample mean
• Sample Mean is a random variable
• Has its own mean and standard
deviation
find more resources at oneclass.com
find more resources at oneclass.com
Document Summary
Statistical inference: whenever a sample is selected to either learn something about, or draw conclusions regarding a larger group of items (population) The manufacturer needs to regularly test the machine to make sure that it is filling correctly. If we calculate a statistic from a sample, will it exactly represent the population parameter (population value) we are interested in: sampling error. Is it likely that the error will be small enough that the sample statistic will be useful: we need to know something about the possible range of errors, and the likely size of errors. Sampling distributions: a sampling distribution is the distribution of possible values any sample statistic may take or spread around the population parameter of interest, the sampling distribution also takes account of the distribution of possible sampling errors. Sampling distribution: every sample statistic calculated is a random variable, every random variable will have a distribution.