ECON204 Lecture Notes - Lecture 3: Workforce, Labour Force Survey, W. M. Keck Observatory

17 May 2018
School
Department
Course
Professor

Topic 3
The Labour Market
Australian Labour Market
2017 Statistics
• Total Population 24.1M
• Civilian Population: 19.89M
• Labour Force: 12.93M
o Employed: 12.2M
o Unemployed: 0.73M
• Participation Rate = 65%
• Unemployment Rate = 5.6%
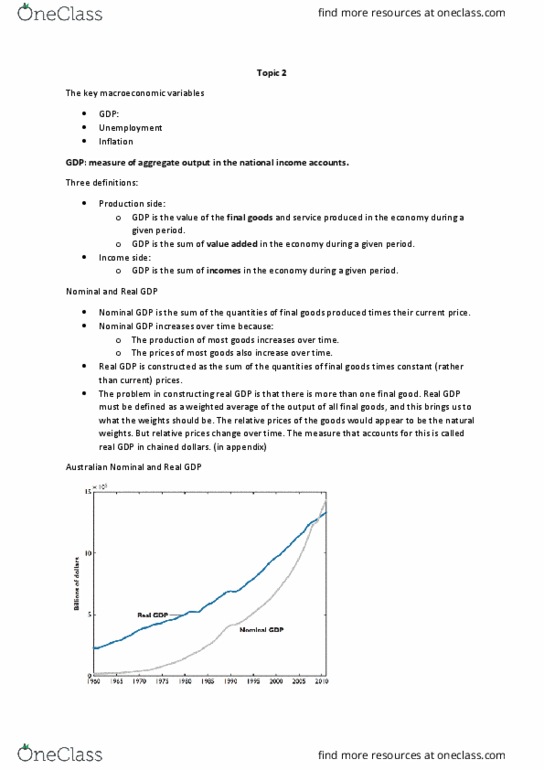
Unemployment Rate
An unemployment rate may reflect two very different realities:
• An active labour market, with many separations and many hires, or
• A sclerotic labour market, with few separations, few hires, and a stagnant unemployment
pool.
Figuring out which reality hides behind the aggregate unemployment rate requires data on the
movements of workers.
LFS produces data for the movements (or flows) of workers:
(1) This is based on a survey of matching individuals over two months This means that some
surveyed in one month might not have been located, and therefore matching in the next
month.
(2) Every month, 1/8 of the sample is discarded and a new set is added. Therefore, individuals in
the survey are kept in the sample for only eight months. In their first month of being
surveyed, the new set cannot have a match over two months.
Average Monthly Flows Between Employment Unemployment, and non-participation (1997-2012)
find more resources at oneclass.com
find more resources at oneclass.com

We can see that:
(1) The flows of workers in and out of employment are very large
a. The majority of separations are voluntary quits (58% in 2010). Workers who leave
their job for a better alternative.
b. The remaining are layoffs, which come mostly from changes in employment levels
across firms. At any time, some firms are suffering decreases in demand and are
decreased their employment, other firms are enjoying increases in demand and
increasing employment.
i. 60% of these worked for less than a year
ii. Half were in temporary or seasonal jobs.
(2) The flows in and out of unemployment are large in relation to the number of unemployed
a. 47% of unemployed leave unemployment
b. The average duration of unemployment is 2-3 months.
c. Economists worry about the proportion of long-term unemployed (ie those whose
duration of unemployment >12 months) because of their diminishing employability
due to loss of skills, confidence etc.
i. Long term unemployment ratio = 23% in Jan 2016
(3) There are also large flows in and out of the labour force, much of them directly to and from
employment
a. Disouraged orkers are lassified as out of the laour fore, ut the a take a
job if they find it. Of those ot i the laour fore:
i. 60% are women
ii. 67% want part time work
iii. For 15-19 year olds, the main activity is education.
iv. 91% were available to start work within 4 weeks
Change in the Composition of Employment
There have been large increases in the proportion of part-time workers in the economy. This has
weakened the relative power of workers in the labour market
Weaker labour power
Though the unemployment rate has fallen from 2014 to 2017, the underemployment rate trends
upward. Is this why wage inflation is surprisingly low?
Movements in Unemployment
Fluctuations in the aggregate unemployment rate affect:
• The welfare of individual workers
o Through a decrease in hires—the unemployed face a lower probability of finding a
job, and the duration of their unemployment is expected to increase.
o Through higher layoffs—higher risk of losing their jobs.
• Wages
When unemployment is high, the proportion of the unemployed finding jobs is low.
When unemployment is high, a higher proportion of workers lose their jobs.
Efficiency Wages (Not In Lecture Slides)
find more resources at oneclass.com
find more resources at oneclass.com
Document Summary
2017 statistics: total population 24. 1m, civilian population: 19. 89m. Labour force: 12. 93m: employed: 12. 2m, unemployed: 0. 73m, participation rate = 65, unemployment rate = 5. 6% An unemployment rate may reflect two very different realities: an active labour market, with many separations and many hires, or, a sclerotic labour market, with few separations, few hires, and a stagnant unemployment pool. Figuring out which reality hides behind the aggregate unemployment rate requires data on the movements of workers. Therefore, individuals in the survey are kept in the sample for only eight months. In their first month of being surveyed, the new set cannot have a match over two months. Average monthly flows between employment unemployment, and non-participation (1997-2012) We can see that: (1) the flows of workers in and out of employment are very large: the majority of separations are voluntary quits (58% in 2010).