PSYC20006 Lecture Notes - Lecture 3: Statistical Hypothesis Testing, Sigma Sd10, Effect Size

23 Aug 2018
School
Department
Course
Professor
Document Summary
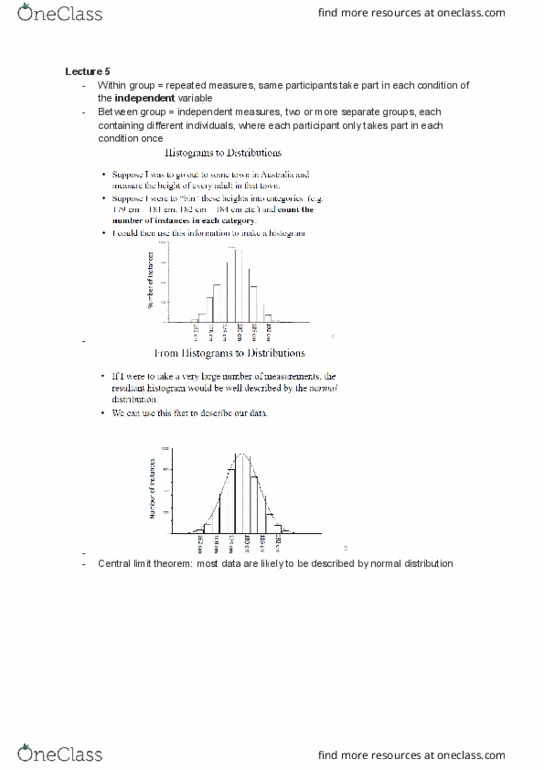
Distributions: mean, variance, s2, calculated by sum of squares (ss) divided by the degrees of freedom (df) Population of distribution: population distribution, distribution of individuals, standard deviation, square root of the variance. If we have the mean and standard deviation, we can describe the population distribution: we assume it is normal, centred on the mean, most individuals will have a score within 2 standard deviations of the mean. If you have 1 sample, and you take measurements on it, you may end up with a mean=60 and a sd=10: tells us how much variation is in our sample. If our observations are normally distributed: this is the standard deviation from the mean. If probability is very small: conclude that h0 cannot be true, reject it in favour of h1. Calculating probability: single sample t test: t statistic, represents how much greater/less the sample mean is then the assumed population mean, relative to the standard error.