FIT3179 Lecture 2: Choropleth Maps

11 Aug 2018
School
Department
Course
Professor
Document Summary
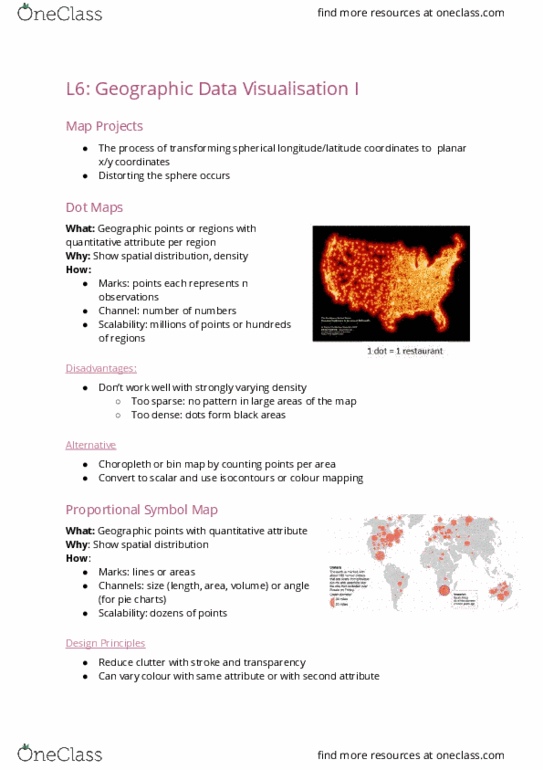
Categorical : geolocation maps with di erent colours. Ordered : age brackets, the di erent groups. Main agricultural crop, di erent colours can be di erent types. Loss in terms of money in each state: Trying to show the worst state in categorical presentation. Can"t tell which one is the the worst at a glance. One colour is representing two di erent states. We don"t know which one its showing on the map. User must look at the colour on the map. Use brightness of the hues to show quantity. Can see where there is the least loss and the most loss. The classes are too large in range. Doesn"t take into account that some states have more people so the loss will be higher. It takes into account the whole population in state. Expressed as angular direction on the colour wheel. Primary luminance changes : the more the darker. Slight change in hue for diverhing distributions.