MKC2500 Lecture 6: Notes

18 Jun 2018
School
Department
Course
Professor

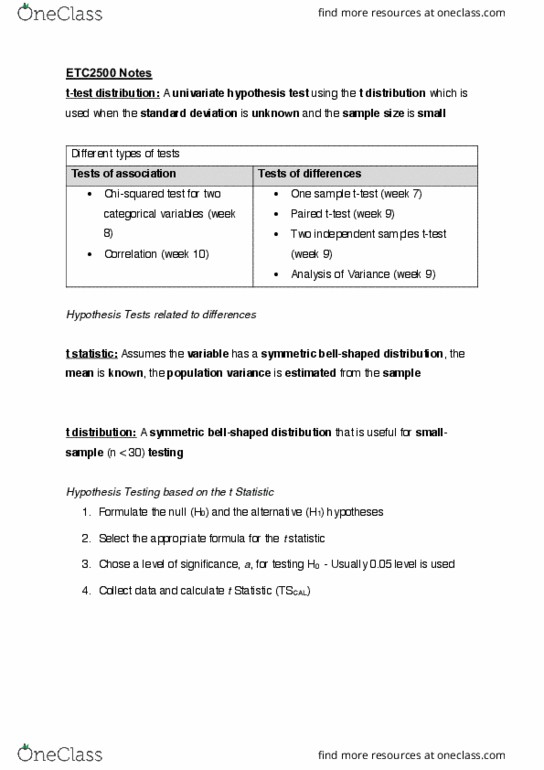
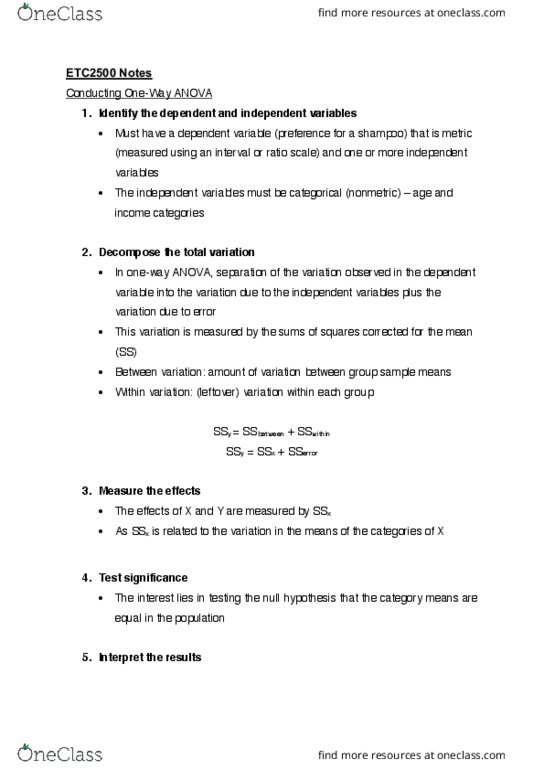
ETC2500 Notes
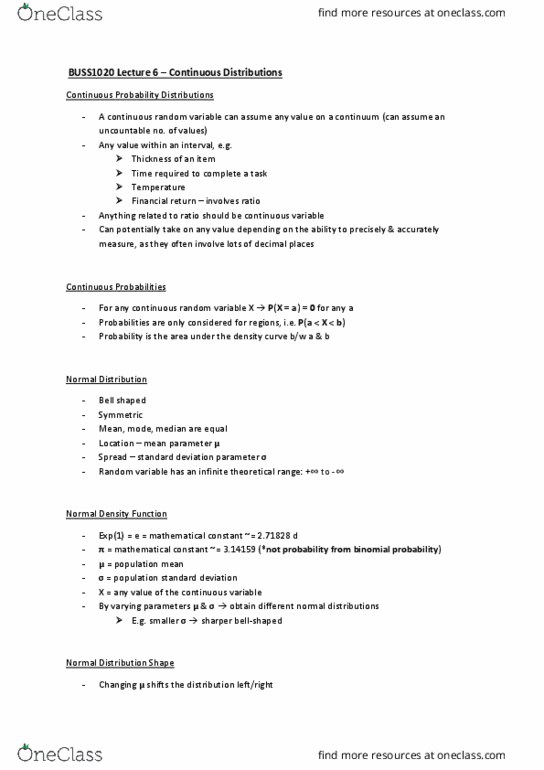
Normal Distribution
We#often#need#to#choose#a#probability#distribution#as#a#characterisation#of#a#population#
variable#
Consider#N#μ,#σ2##as#a#population#distribution#
bell-shaped#curve#
μ#is#the#population#mean,#identifying#the#location#of#the#middle#of#the#distribution#
σ2#is#the#population#variance,#identifying#the#ë spreadı́of#the#distribution#
The#normal#distribution#is#
Suitable#for#scale#(interval,#ratio)#numeric#data#types#
Variable#values#are#just#as#likely#to#be#greater#than#μ#as#to#be#less#than#μ#Symmetric#
around#its#mean#value#μ##
#
Document Summary
We often need to choose a probability distribution as a characterisation of a population variable. Consider n , 2 as a population distribution bell-shaped curve. Is the population mean, identifying the location of the middle of the distribution. 2 is the population variance, identifying the e spread of the distribution. Suitable for scale (interval, ratio) numeric data types. Variable values are just as likely to be greater than as to be less than symmetric around its mean value . If you sampled many independent values from the normal population, you would expect to see. Most (more than 99%) of those values within 3 units away from the mean . About 95% of those values within 2 units away from the mean . About 66% of those values within 1 units away from the mean . If you are interested in a n( , 2) distribution, you can work out probabilities using a normal table.