MKC2500 Lecture Notes - Lecture 17: Statistic, Ordinal Data, Rishi

18 Jun 2018
School
Department
Course
Professor

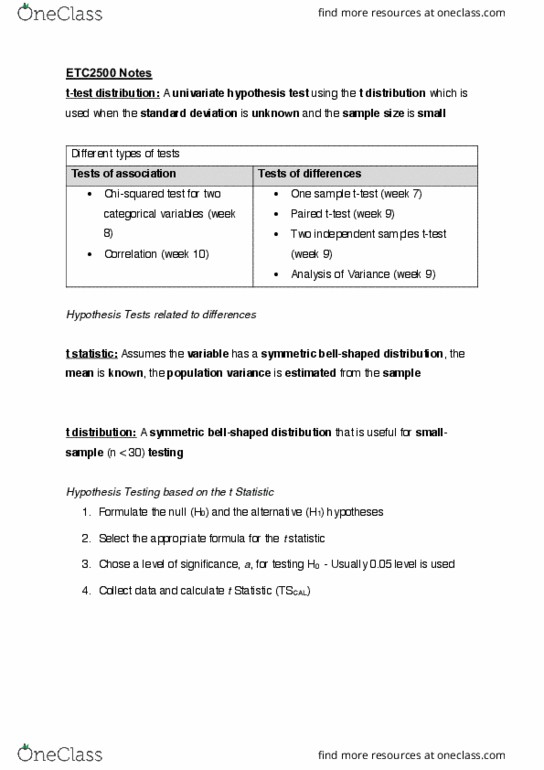
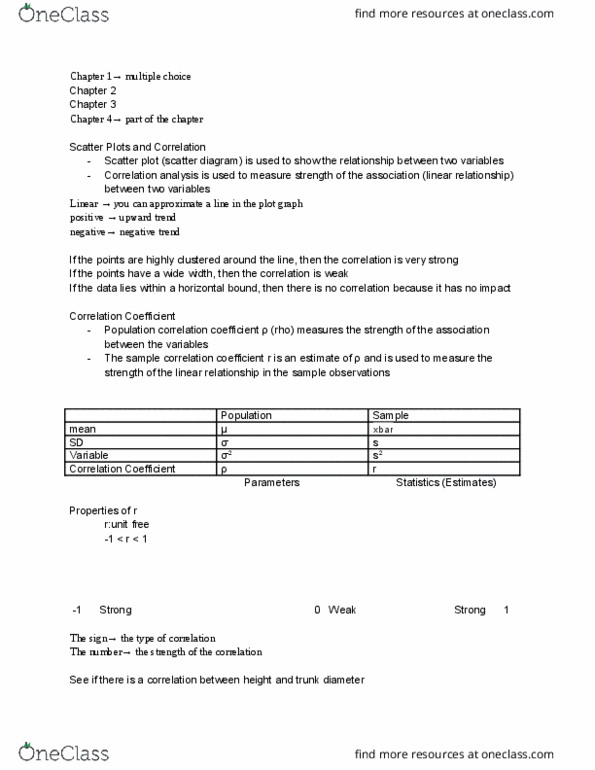
ETC2500 Notes
Pearson Correlation
• Correlation is a standardised statistical measure of the covariation, or
association, between two variables
o Used for scale variables
• Pearson Correlation is the most commonly used sample correlation measure
• It measures the linear association between sampled values of x and y
• It is not affected by the unit of measurement – is always scaled to the interval
-1 ≤ rp ≤ 1
If there is a perfect linear (straight-line) relationship in the data, then
rp = 1 (positive relationship) rp = -1 (negative relationship)
The size of correlation coefficient tells us the strength of the relationship between
two variables
• rp is a sample statistic - so it is a function of the observed sample data.
• It is an estimator for the true population (linear) correlation quantity ρ
• Condence intervals for ρ can be obtained
• We can test to see if the sample data provides sufficient evidence of a non-
zero population correlation
H0 : ρ = 0 versus H1 : ρ ≠ 0
H0 : There is no linear association between the two variables x and y in the
population
H1 : There is a linear association between the two variables x and y in the
population
SPSS: ANALYZE/ CORRELATE/ BIVARIATE menu option
Document Summary
Pearson correlation: correlation is a standardised statistical measure of the covariation, or association, between two variables, used for scale variables, pearson correlation is the most commonly used sample correlation measure. It measures the linear association between sampled values of x and y. It is not affected by the unit of measurement is always scaled to the interval. If there is a perfect linear (straight-line) relationship in the data, then rp = 1 (positive relationship) rp = -1 (negative relationship) The size of correlation coefficient tells us the strength of the relationship between two variables rp is a sample statistic - so it is a function of the observed sample data. It is an estimator for the true population (linear) correlation quantity : condence intervals for can be obtained, we can test to see if the sample data provides sufficient evidence of a non- zero population correlation.