BSB123 Lecture Notes - Lecture 5: Probability Distribution, Normal Distribution, Standard Deviation


Data Analysis – The Normal Distribution
- Normal Distribution
oOne of the most important and widely used probability distribution of statistical
inference
oMany business and social phenomena produce random variables which conform to
the normal distribution
oNormal distributions can be used to approximate other probability distributions
oCharacteristics
Bell-shaped and perfectly symmetrical around its mean
Mean, median, and mode are the same
The random variable is continuous and assumes any values between
negative infinity to positive infinity
Area under curve = 1
Area to either side of the mean is 0.5
oMean and standard deviation uniquely determine a normal distribution
oDistribution with the same mean but different standard deviation:
Middle point is the same, but one is shorter and longer
oDistribution with same standard deviation but different mean
Height is the same and length is the same, but curve is in a different place
on graph
oDifference between continuous and discrete probability distributions
Nature of sample space
Discrete – sample space has a countable number of values, these
can be listed and associate a probability to each of the values
Continuous – random variable can take on infinitely many values
within an interval, probability of it assuming any particular value is
infinitely small (or 0)
Probability of a continuous random variable is only meaningful is the
event is an interval
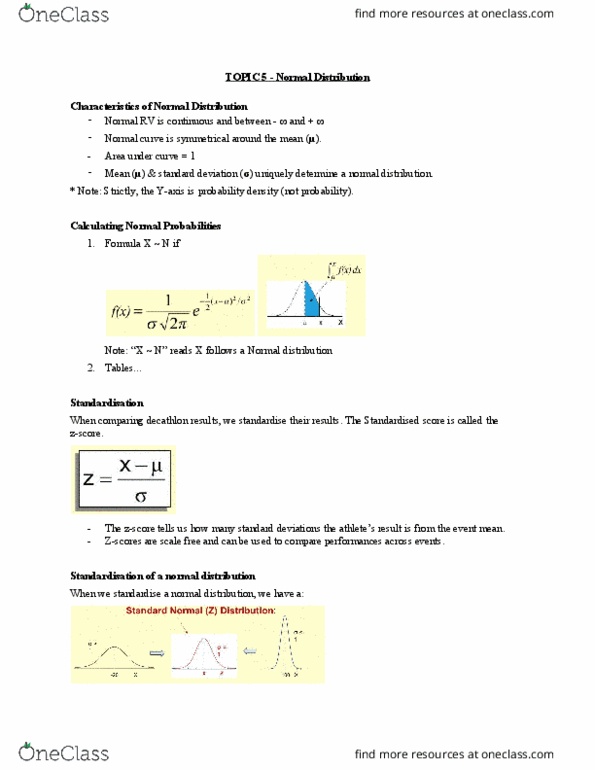
oCalculating normal probabilities
Calculate the area in the interval under the curve
Use standardisation
- Standardisation
find more resources at oneclass.com
find more resources at oneclass.com
Document Summary
Mean, median, and mode are the same. The random variable is continuous and assumes any values between negative infinity to positive infinity. Area to either side of the mean is 0. 5: mean and standard deviation uniquely determine a normal distribution, distribution with the same mean but different standard deviation: Middle point is the same, but one is shorter and longer: distribution with same standard deviation but different mean. Height is the same and length is the same, but curve is in a different place on graph: difference between continuous and discrete probability distributions. Discrete sample space has a countable number of values, these can be listed and associate a probability to each of the values. Continuous random variable can take on infinitely many values within an interval, probability of it assuming any particular value is infinitely small (or 0) Probability of a continuous random variable is only meaningful is the event is an interval: calculating normal probabilities.