BIOL 3P96 Lecture Notes - Lecture 13: Sampling Distribution, Statistical Hypothesis Testing, Logarithm

25 Jul 2015
School
Department
Course
Professor
Document Summary
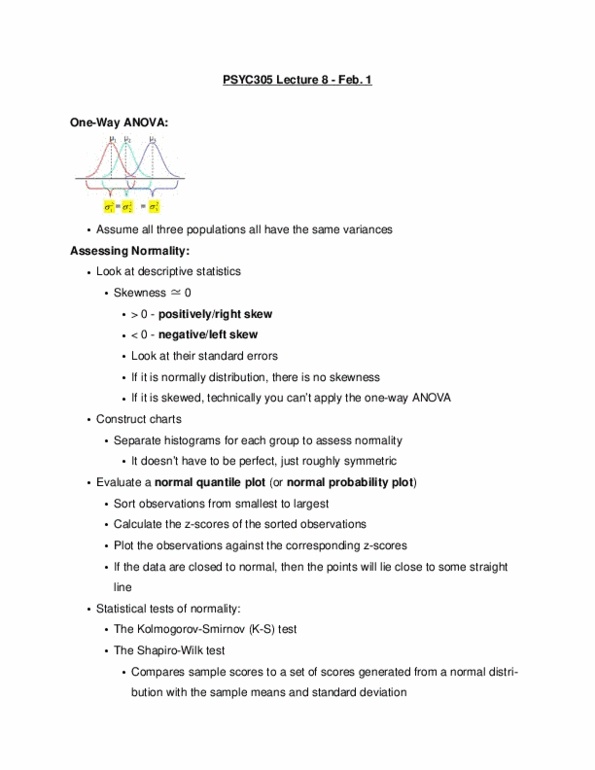
Biol 3p96 lecture 13: handling violations of assumptions. (for 2-sample t) populations have equal variances. Histograms allow for visualization of the data. Data from small sample sizes may be noisy and will likely not follow a perfect bell curve. Data sets drawn from non-normal distributions may appear skewed or have outliers far outside the rest of the data. Skew is visible in box plots: normal (symmetric) distribution, skewed right long tail is towards larger values, skewed left - long tail is towards smaller values. Compares each observation in the sample with its quantile expected from the standard normal distribution. Points should fall roughly in a straight line if the data come from a normal distribution. Data are ordered from smallest to largest and given a rank of i. Corresponding normal quantile is the standard normal deviate z having an area in the tail equal to i/(n+1)