GEOG 1F90 Lecture Notes - Lecture 10: Pie Chart, Bar Chart, Cumulative Frequency Analysis

8 Dec 2017
School
Department
Course
Professor
Document Summary
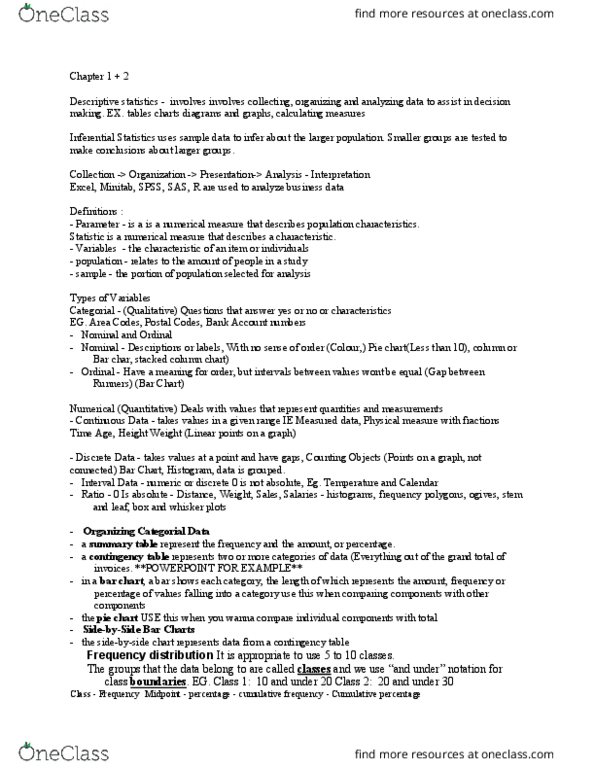
Descriptive statistics - involves involves collecting, organizing and analyzing data to assist in decision making. Ex. tables charts diagrams and graphs, calculating measures. Inferential statistics uses sample data to infer about the larger population. Smaller groups are tested to make conclusions about larger groups. Collection -> organization -> presentation-> analysis - interpretation. Excel, minitab, spss, sas, r are used to analyze business data. Parameter - is a is a numerical measure that describes population characteristics. Statistic is a numerical measure that describes a characteristic. Variables - the characteristic of an item or individuals. Population - relates to the amount of people in a study. Sample - the portion of population selected for analysis. Categorial - (qualitative) questions that answer yes or no or characteristics. Nominal - descriptions or labels, with no sense of order (colour,) pie chart(less than 10), column or bar char, stacked column chart)