MATH 1F92 Lecture Notes - Lecture 5: Scatter Plot

19 Oct 2017
School
Department
Course
Professor
Document Summary
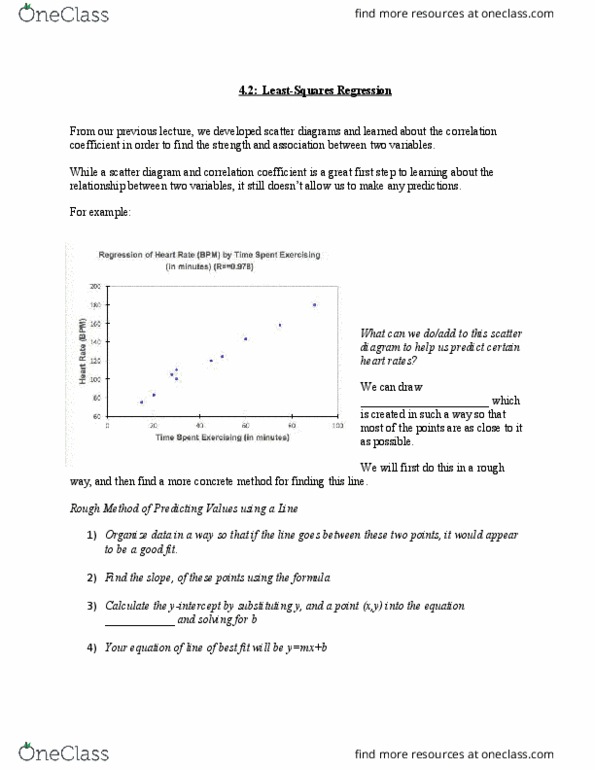
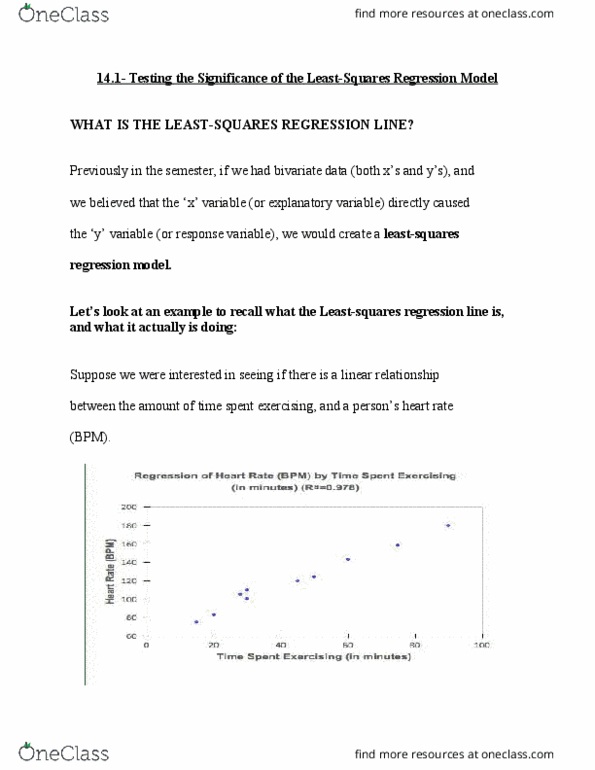
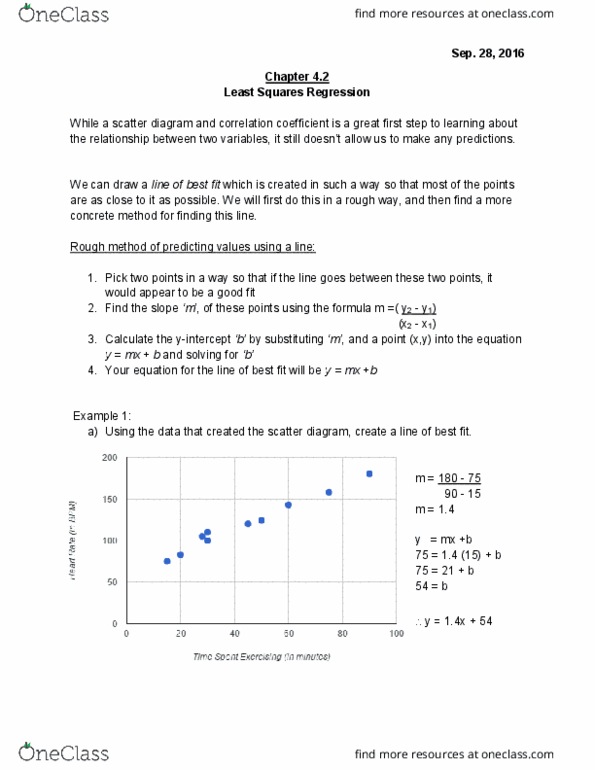
4 data points on the line but the rest of data is above it. We are going to use the line of best fit (cid:894)or line of regression(cid:895) Line of best fit: line that best approximates data. Recall: y = mx + b (equation of a line) B, x, + bo regression line egh. Predicted value of y given some specific x. If b > 0 (positive) = x up, y down (r > 0) If b < 0 (negative) = x up, y down (r < 0) If b = 0, horizontal line, no slope up or down. We can rearrange the equation for bo bo = b, x. This describes the relationship between x and y: only use least square regression of moderate or better. To find the line: use least square regression, minimize the vertical distance between data values and the line used to approximate them. Residual: the distance between the observed and predicted value of y.