PSYC 2F23 Lecture Notes - Lecture 3: Frequency Distribution, Minimax, Railways Act 1921


Document Summary
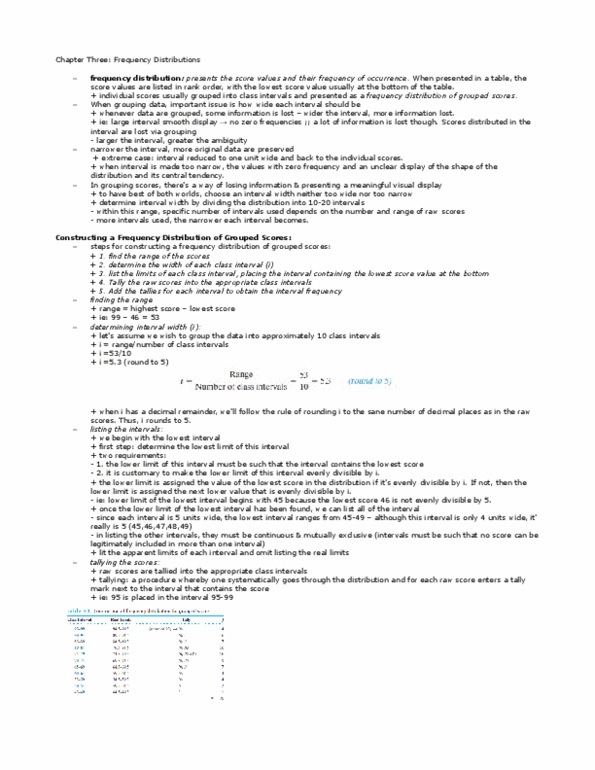
Frequency distributions present the scores and their frequency of occurrence. We take max-min and divide that by number of intervals we want. Round to 5 or 10 whichever is closest. Lower limit of each interval should be divisible by interval width. Example if lowest number is 26 and interval is 5, our first interval will start at 25 and be 25-29. = frequency/n of data points from all intervals. What percentage of all people scored within a certain interval. Adding all the frequency from all intervals below. Ex is cumf for 30-34 it is saying frequency from 30-25 essentially. Cumf for last interval should= total number of ppt. Percentage of scores below the upper real limit of each interval. Find lower real limit of the interval containing the score. Calculate number of additional score need to reach percentile point. Determine number of units within the interval to reach percentile.