COMM 2002 Lecture Notes - Lecture 7: Normal Distribution, Sampling Distribution, Confidence Interval

2 Nov 2015
School
Department
Course
Professor
Document Summary
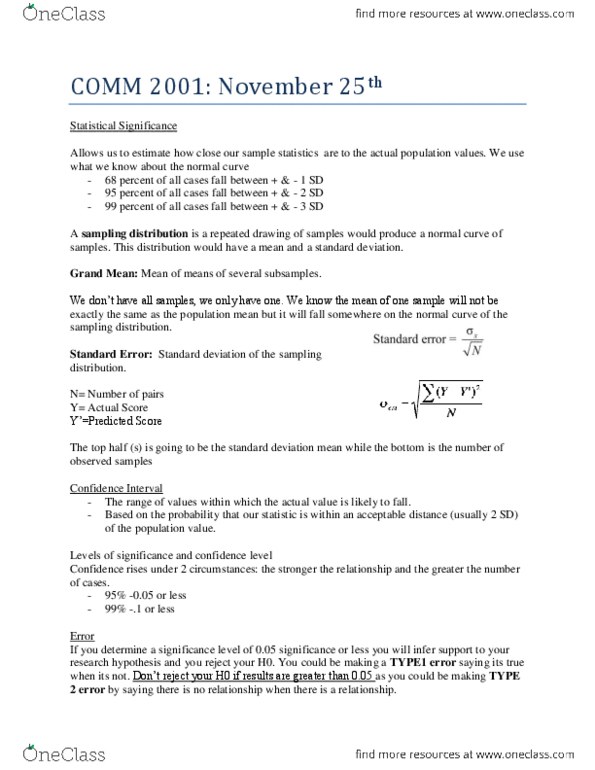
Allows us to estimate how close our sample statistics are to the actual. Uses what we know about the normal curve. 68% of all cases fall between +- 1 sd. 95% of all cases fall between +- 2 sd. 99% of all cases fall between +- 3 sd. Refers to the confidence we can have that our results did not occur by chance alone. Only relevant if we have a sample if we had the population the more confident we can be in the sample statistics. We can never be totally sure and therefore we speak in probabilities the number of times out of 100 the results exist in the population. Sometimes our sample will not be representative even with proper sampling methods. We need to conceive of the notion of a sampling distribution. Repeated drawing of samples would produce a normal curve of samples. The distribution would have a mean and a standard deviation (grand mean, standard error)