COMM 215 Lecture Notes - Lecture 3: Standard Deviation, Interquartile Range, Quartile

18 Jan 2017
School
Department
Course
Professor
Document Summary
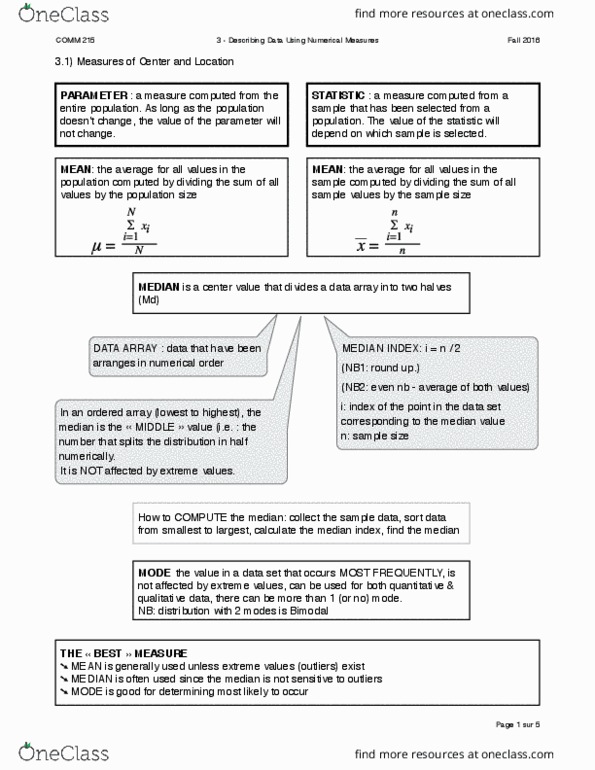
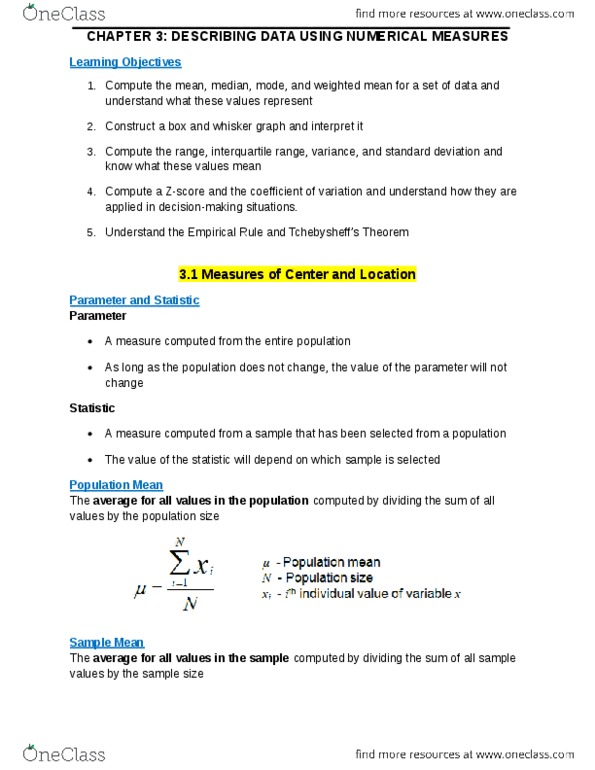
Comm 215 - lecture 3 - describing data using numerical measures. Can change if you redo experiment with a different sample. Avg of variables = sum of var / population size. Center value - divides data array into 2 halves (md) - it"s the middle #) Ex: 1 2 3 4 8 - median is 3. If i is not an integer: round up. If i is an integer: median = average of (i + (i+1)) 0. 5 * 7 = 3. 5, round to 4. Data set w/ values evenly spread along the centre. Ex: 1 2 2 3 3 3 3 3 44 88 - mode is 3. Want to know what"s most likely: use mode. Mean value of data that"s been weighted based on relative importance. How to find it: collect data & assign weights, multiply weight by data, sum all weights, compute weighted mean.