MATH 1060 Lecture 4: Distribution Shape

MATH 1060 verified notes
4/11View all
Document Summary
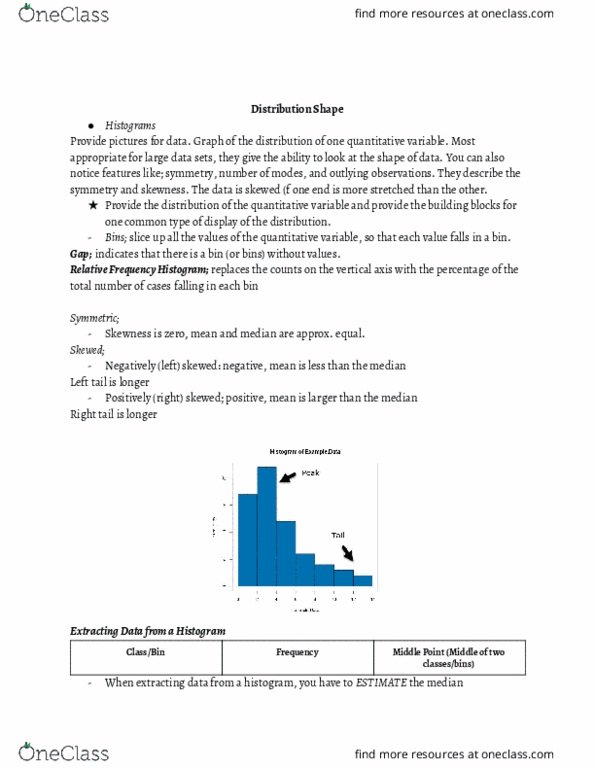
Graph of the distribution of one quantitative variable. Most appropriate for large data sets, they give the ability to look at the shape of data. You can also notice features like; symmetry, number of modes, and outlying observations. The data is skewed (f one end is more stretched than the other. Provide the distribution of the quantitative variable and provide the building blocks for one common type of display of the distribution. Bins; slice up all the values of the quantitative variable, so that each value falls in a bin. Gap; indicates that there is a bin (or bins) without values. Relative frequency histogram; replaces the counts on the vertical axis with the percentage of the total number of cases falling in each bin. Skewness is zero, mean and median are approx. equal. Negatively (left) skewed: negative, mean is less than the median. Positively (right) skewed; positive, mean is larger than the median.