ECON-1006EL Lecture Notes - Lecture 2: Dysgeusia, Demand Curve

20 Jun 2018
School
Department
Course
Professor

Part C
In micro economics, many supply and demand curves are represented. These curves also
endure shifts which include: and increase or decrease of demand, supply, income, resources
and their prices. The Law of Demand states that a higher price for a good or service, other
things equal, leads people to demand a smaller quantity of that good or service. When a
Movement along the demand curve occurs is means that there is a change in the quantity
demand of a good arising from a change in the good’s price, this can be negative or positive.
This movement does not change the location of the demand or supply curve, rather moving
along (up or down) the pre existing curve.
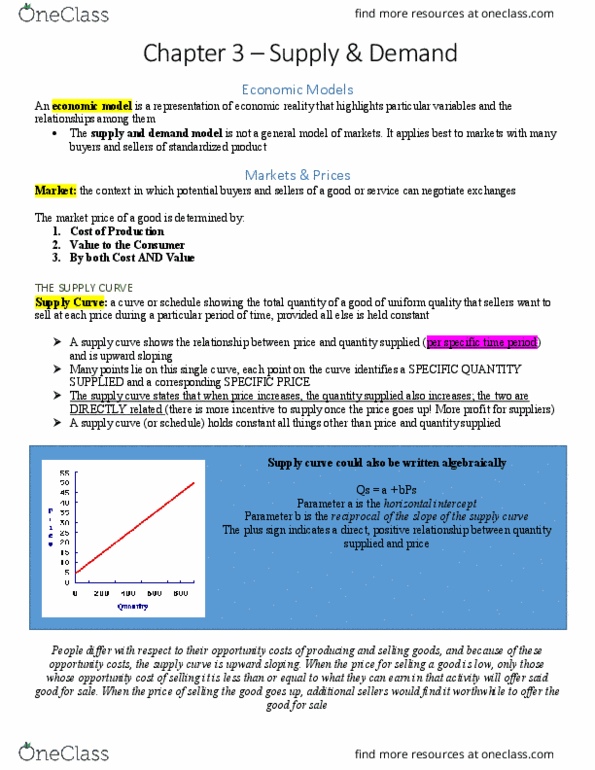
Supply Schedule: Shows how much of a good or service would be supplied at different prices.
Demand Schedule: Shows how much of a good or service consumers will want to buy at
different prices.
Mainly, the demand changes from D1 to an increase in demand referred to D2 or a decrease in
demand D3
Supply, Demand, and Equilibrium: The intersection of the supply and demand curve shows
when equilibrium of quantity and price is reached; this point is marked as E. As shifts occur new
equilibriums may be created; E1, E2 etc. Sometimes, only one curve will shift and one will shift
Understanding the shifts
Supply
Effecting the shift:
-Change in input prices
-Changes in the prices of related goods or
service
-Changes in technology
-Changes in weather
-Changes in expectations
-Changes in number of producers
The movement along the supply curve occurs as a
result of a rise in the price of the good whereas
the shift of the supply curve is a result of an
increase in the quantity supplied at any given
price.
Demand
Effecting the shift:
-Changes in the prices of related goods or
services
-Changes in income
-Changes in taste
-Changes in expectation
-Changes in the number of consumers
Movement along the demand curve occurs
because of a result of the fall in price of the good.
A shift of the demand curve is resulted due to a
rise in the quantity demanded at any given price.
find more resources at oneclass.com
find more resources at oneclass.com
Document Summary
In micro economics, many supply and demand curves are represented. These curves also endure shifts which include: and increase or decrease of demand, supply, income, resources and their prices. The law of demand states that a higher price for a good or service, other things equal, leads people to demand a smaller quantity of that good or service. Movement along the demand curve occurs is means that there is a change in the quantity demand of a good arising from a change in the good s price, this can be negative or positive. This movement does not change the location of the demand or supply curve, rather moving along (up or down) the pre existing curve. Supply schedule: shows how much of a good or service would be supplied at different prices. Demand schedule: shows how much of a good or service consumers will want to buy at different prices. Changes in the prices of related goods or service.