BIOL-208 Lecture Notes - Lecture 12: Net Reproduction Rate, Fecundity, Exponential Growth

17 Dec 2016
School
Department
Course
Professor

Population Growth
- Mathematical models
- Something that mimics how we think reality is
- Formal description of an idea
- Not magic, not a law, just an idea, so it is consistently being refined
- Today’s perspective “biology behind the model”
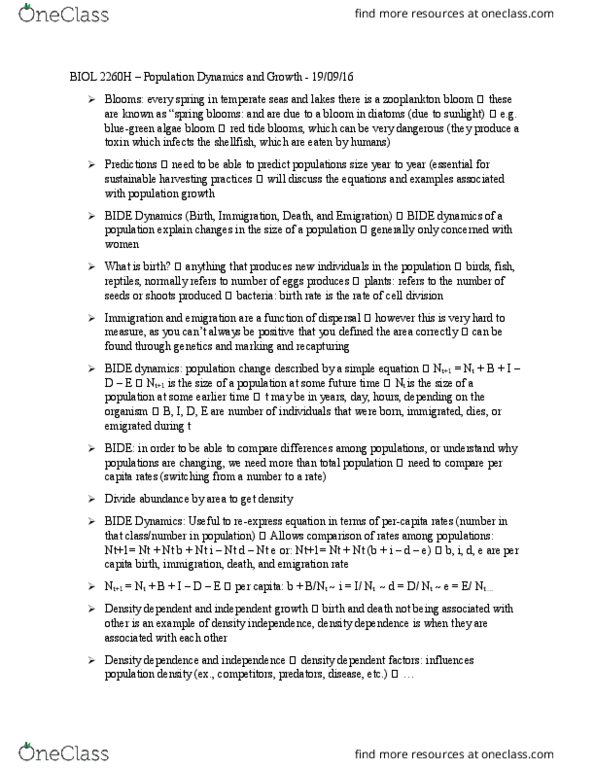
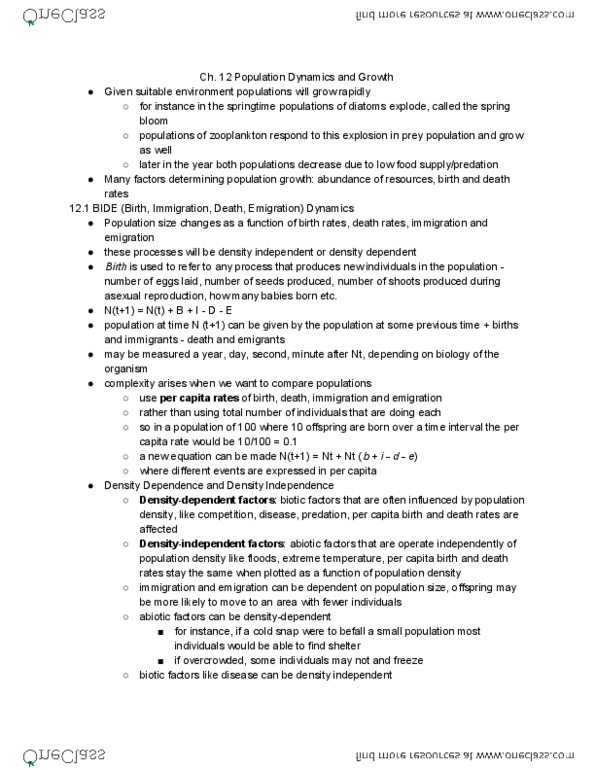
- BIDE Dynamics - Limits on population growth
- Stands for Birth, Immigration, Death, and Emigration
- Births shown as eggs, seeds, shoots, and cell division
- Equation
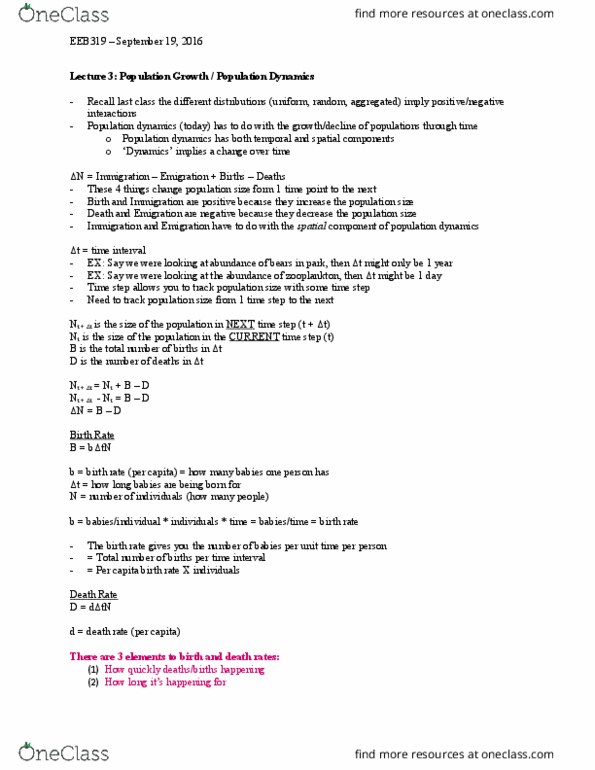
- Nt+1 = Nt + B + I - D - E
- Nt+1 is the population at some future time
- Nt is the population at some earlier time
- + 1 is the time interval
- Problematic
- Compare differences among populations (cohorts)
- Understand why changes occur
- How to understand
- Find difference in per capita rates
- Total number of BIDE
- E.g for births
- 100 in population produce 10 offspring
- Per capita rate: 0.10 offspring per individual per interval
- Density (in)dependence
- Abiotic versus biotic factors (“limiters”)
- Density-dependent: biotic
- Competition, disease, predation
- Density-independent: abiotic
- Floods, drought, extreme temperatures
- On the graphs, where the lines intersect is when the population is stable
- When bird population density too high, starts eating parts of cactus they
don't normally eat, which damages and destroys their food source.
However, this cactus dies when it rains too much, which limits the birds
growth when it rains
- Rates of population change
- Life tables: track age-specific mortality and birth rates
- Fecundity schedule: birth rate for females of different ages
- Combine these two reveals that net reproductive rate (R0) is the average number
of offspring produced by an individual per population per generation
- Population growth
- Rate of increase: non-overlapping generations
- Phlox
- Ratio of population at two points in time
- Geometric rate of increase
find more resources at oneclass.com
find more resources at oneclass.com
Document Summary
Something that mimics how we think reality is. Not magic, not a law, just an idea, so it is consistently being refined. Bide dynamics - limits on population growth. Stands for birth, immigration, death, and emigration. Births shown as eggs, seeds, shoots, and cell division. Nt+1 = nt + b + i - d - e. Nt+1 is the population at some future time. Nt is the population at some earlier time. Per capita rate: 0. 10 offspring per individual per interval. On the graphs, where the lines intersect is when the population is stable. When bird population density too high, starts eating parts of cactus they don"t normally eat, which damages and destroys their food source. However, this cactus dies when it rains too much, which limits the birds growth when it rains. Life tables: track age-specific mortality and birth rates. Fecundity schedule: birth rate for females of different ages.