ECON 209 Lecture Notes - Lecture 2: Real Interest Rate, What Lies Ahead, Nominal Interest Rate

Document Summary
Get access


Related Documents
Related Questions
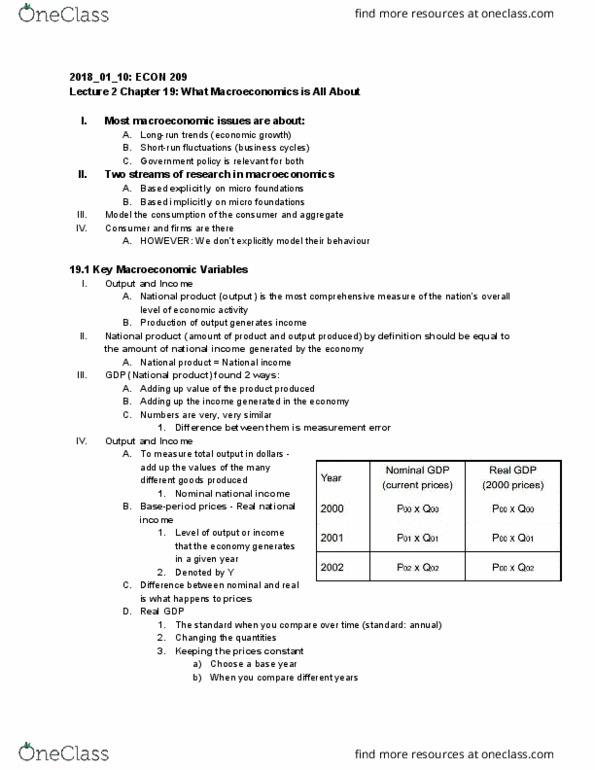
| Annual Growth Rates of Real GDP Per Capita (in percents) | |||||||||||||
| Ending | |||||||||||||
| 1929 | |||||||||||||
| 1933 | -8.2 | ||||||||||||
| 1939 | 0.2 | ||||||||||||
| 1940 | 0.9 | ||||||||||||
| 1945 | 3.7 | 10.3 | |||||||||||
| 1950 | 2.4 | 4.1 | -1.8 | ||||||||||
| 1955 | 2.4 | 3.6 | 0.4 | 2.7 | |||||||||
| 1960 | 2.2 | 2.9 | 0.6 | 1.7 | 0.8 | ||||||||
| 1965 | 2.4 | 3.0 | 1.3 | 2.3 | 2.1 | 3.5 | |||||||
| 1970 | 2.3 | 2.9 | 1.5 | 2.3 | 2.2 | 2.9 | 2.3 | ||||||
| 1975 | 2.3 | 2.7 | 1.5 | 2.2 | 2.0 | 2.4 | 2.0 | 1.6 | |||||
| 1980 | 2.3 | 2.7 | 1.7 | 2.2 | 2.1 | 2.5 | 2.2 | 2.1 | 2.6 | ||||
| 1985 | 2.3 | 2.6 | 1.7 | 2.2 | 2.2 | 2.4 | 2.2 | 2.1 | 2.4 | 2.2 | |||
| 1990 | 2.3 | 2.6 | 1.8 | 2.2 | 2.2 | 2.4 | 2.2 | 2.2 | 2.4 | 2.2 | 2.3 | ||
| 1995 | 2.2 | 2.5 | 1.7 | 2.1 | 2.1 | 2.3 | 2.1 | 2.0 | 2.1 | 1.9 | 1.8 | 1.3 | |
| 2001 | 2.3 | 2.5 | 1.9 | 2.2 | 2.2 | 2.3 | 2.2 | 2.2 | 2.3 | 2.2 | 2.2 | 2.1 | 2.8 |
| 1929 | 1940 | 1945 | 1950 | 1955 | 1960 | 1965 | 1970 | 1975 | 1980 | 1985 | 1990 | 1995 | |
| Starting Year | |||||||||||||
Source: Economic Report of the President, various years.
This table keeps changes in real GDP from being overstated by adjusting for
Select one:
a. productivity.
b. inflation.
c. standard of living.
d. population growth.
Question 2
Not yet answered
Marked out of 1.00
Flag question
Question text
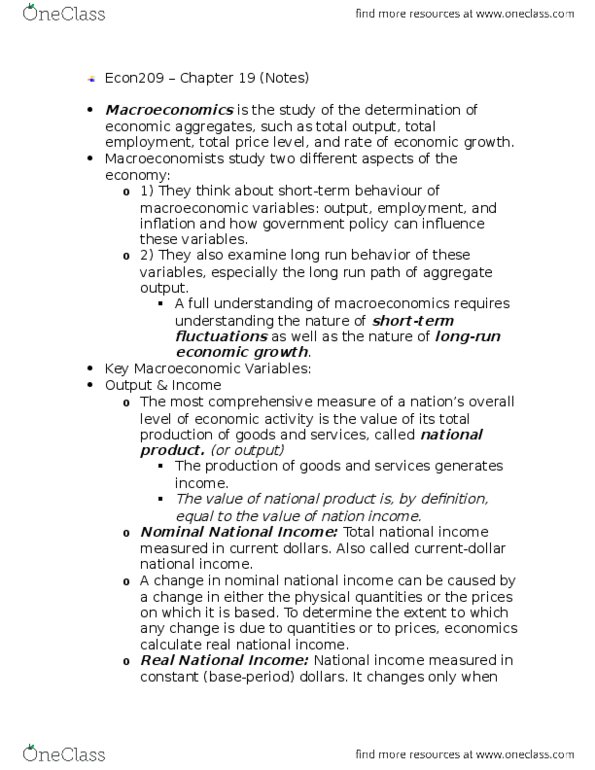
| Per Capita GDP | |
| Luxembourg | $33,609 |
| United States | $33,586 |
| Switzerland | $27,126 |
| Japan | $23,311 |
| Iceland | $23,230 |
Economists use numbers such as those in the table as a measure of
Select one:
a. net exports.
b. total dollar value of all final goods and services.
c. national income.
d. standard of living.
Question 3
Not yet answered
Marked out of 1.00
Flag question
Question text
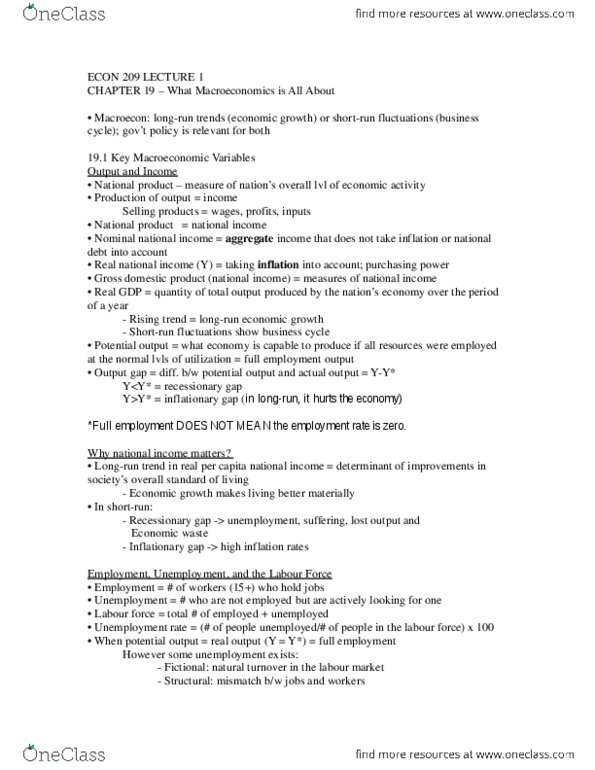
| Per Capita GDP | |
| Luxembourg | $33,609 |
| United States | $33,586 |
| Switzerland | $27,126 |
| Japan | $23,311 |
| Iceland | $23,230 |
The numbers in this table were calculated by
Select one:
a. multiplying GDP by total population.
b. dividing GDP by total population.
c. adding the dollar value of all final goods and services produced in the nation.
d. subtracting net exports from GDP.
Question 4
Not yet answered
Marked out of 1.00
Flag question
Question text
| A key gauge of future U.S. economic activity declined 0.5% last month, as the Sept. 11 terrorist attacks in New York and Washington weakened an already troubled economy. The Conference Board said Monday its index of leading economic indicators fell to 109.2 in September,...the largest one-month decline since January 1996.... The index indicates where the overall U.S. economy is headed in the next three to six months.... The economy had been struggling for several months before the Sept. 11 attacks. Many economists have said they believe that a recession is unavoidable with the new uncertainties raised by the disaster. Source: âLeading Indicators Decline,â USAToday.com, October 22, 2001. |
The passage discusses a business fluctuation influenced by
Select one:
a. external shock.
b. monetary factors.
c. innovation.
d. capital expenditures.
Question 5
Not yet answered
Marked out of 1.00
Flag question
Question text
| For all the recent talk of cutting taxes, Congress rarely cuts them when the economy is growing robustly, as it is now, and unemployment is low. The worry among economists is that the extra money in peopleâs pockets may make an already strong economy too strong, finally stoking inflation after a long period of relatively stable prices.
|
The passage describes rising inflation as a possible result of
Select one:
a. a booming economy.
b. rising unemployment.
c. tax cuts.
d. a prolonged period of stable prices.
1. What component of GDP (if any) will each of the following transactions affect? Explain.
a) A family buys a new refrigerator.
b) Aunty Jane buys a new house.
c) Kina Pharma sells drugs from its inventory.
d) Emmanuel buys a pizza.
e) The government builds a new Motorway from Accrato Kumasi
f) You buy a bottle of California wine.
g) Samsung build an assembly plant in Ghana.
2. Consider an economy that produces only four types of fruit: apples, oranges, pineapples, and bananas. In the base year (2017), the production and price data were as follows:
| Fruit | Quantity | Price |
| Apple | 3,000 | $2 |
| Banana | 6,000 | $3 |
| Pineapple | 4,000 | $1.5 |
| Oranges | 8,000 | $4 |
In the current year (2020), the production and price data are as follows:
| Fruit | Quantity | Price |
| Apples | 4,000 | $3 |
| Banana | 14,000 | $2 |
| Pineapple | 7,500 | $2 |
| Orange | 32,000 | $5 |
(a) Calculate the nominal GDP in the current year and in the base year. What is the percentage increase since the base year?
(b) Calculate the real GDP in the current year and in the base year. By what percentage does real GDP increase from the base year to the current year?
(c) Find the GDP deflator for the current year and the base year. By what percentage does the price level change from the base year to the current year?
(d) Would you say that the percentage increase in nominal GDP in this economy since the base year is due more to increases in prices or increases in the physical volume of output?
3. The following information is obtained from the World Bank’s World Development Indicators on the Economy of Ghana for the year 2015:
i) GDP per capita (constant 2000 US$) - $1696.08
ii) GDP per capita (current US$) - $1381.41
ii) GDP per capita, PPP (constant 2005 International $) - $3953.21
a) What factors could account for the difference between the figures in i) and ii)
b) What factors could account for the difference between the figures in i) and iii)?
c) What factors could account for difference between the figures in ii) and iii)?
4. The following relationships hold in the economy of Matata Island:
𝐶 = 320 + 0.4(𝑌 − 𝑇)
𝐼 = 150
𝐺 = 275
𝑇 = 200
a) Explain the concepts of marginal propensity to consume (MPC) and marginal propensity to save (MPS).
b) What is the MPC for this economy?
c) Explain the concepts of the autonomous spending and tax multipliers.
d) What is the autonomous spending multiplier for this economy?
e) What is the equilibrium level of income for this economy?
f) Suppose that the full employment level of output for this economy is 4000. What sort of output gap is Matata island facing?
g) What kind of policy can the government use to close this kind of gap? Explain with the aid of a diagram.
5. a) For the purposes of assessing an economy's growth performance, which is the more important statistic: real GDP or nominal GDP? Why?
b) Why are goods and services counted in GDP at market value? Explain.
c) What is the difference between intermediate good and final good? Why is the distinction important for measuring GDP?

