MATH 223 Lecture Notes - Lecture 6: Static Variable, False Positive Rate, Sensitivity And Specificity

21 Oct 2020
School
Department
Course
Professor
Document Summary
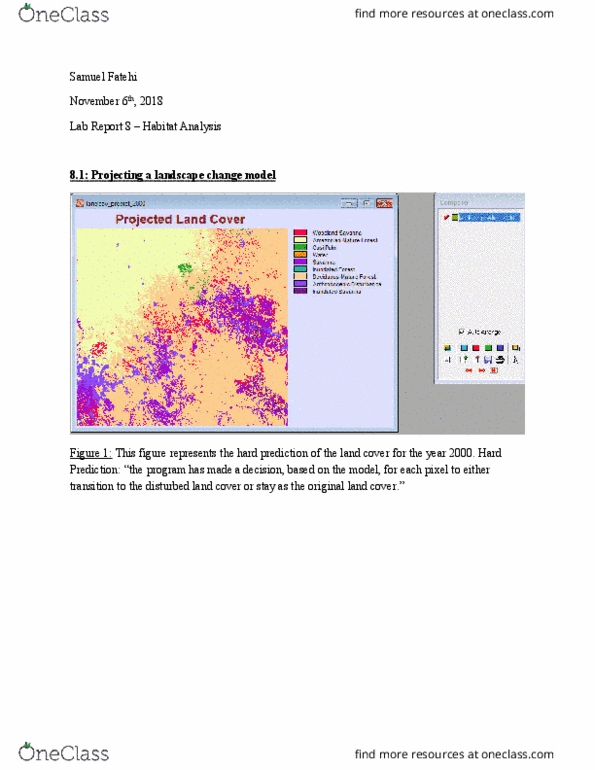
8. 1 projecting a landscape change model: prediction image. Figure 1: the map above demonstrates a hard prediction of the 2000 land cover, which means that the program decided which pixels will be transitioned to the land cover or stay as the original cover. In this case cusi palm, water, and inundated savanna will remain identical to the model from 1994: the predicted amount of disturbance in 2000 showed that anthropogenic disturbance increased from. 1986 to 1994 and to 2000 increased from 1986 hectares to 27799 hectares to 39565 hectares respectively. However, comparing the predicted value of anthropogenic disturbance in 2000 to the actual value of the anthropogenic disturbance which was equal to 69051, we can see that these values are very far from each other. This shows that the model failed to accurately predict the anthropogenic disturbance of this land cover since it really underestimated the value of disturbance.