COMMERCE 2AB3 Lecture 3: 3 Lecture 3 - Chapter 10 - Jan 13 - COMM 2AB3.docx

13 Jan 2014
School
Department
Course
Professor
Document Summary
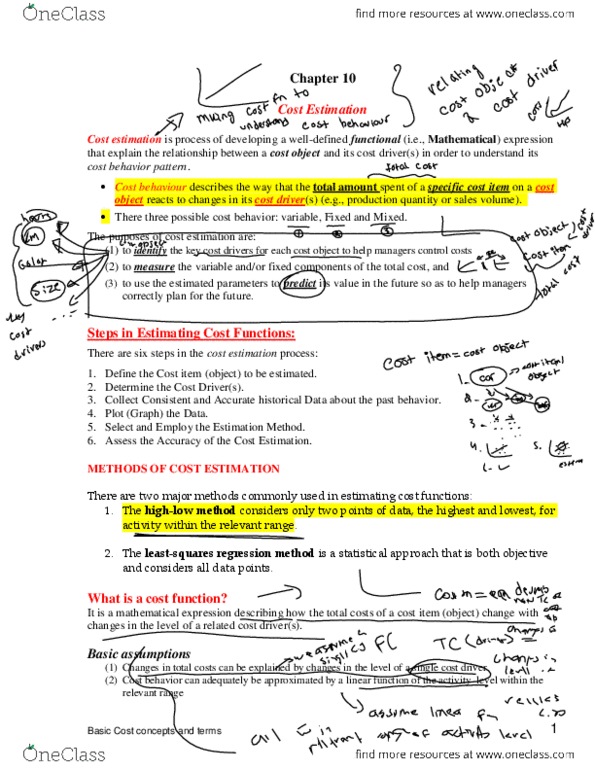
Find relationship between cost driver and cost object: some cost objects may have multiple cost drivers use regression analysis (do not need for this course assume only one cost driver, collect consistent and accurate data, plot (graph) the data, select and employ the estimation method, assess the accuracy of the cost estimation. Basic linear function based on the two basic assumptions, the relationship between a particular cost item and its cost driver in a mathematical form can be expressed in a mathematical form using the straight line equation as follows: y = a + b(x) where: y = total costs; includes variable and fixed costs a = fixed cost component; intercept; total fixed cost b = slope coefficient (variable cost rate); unit variable cost x = the volume (quantity) of the cost driver; independent variable, level of activity: note that: