COMMERCE 2QA3 Lecture 18: 18___

17 Dec 2015
School
Department
Course
Professor

Document Summary
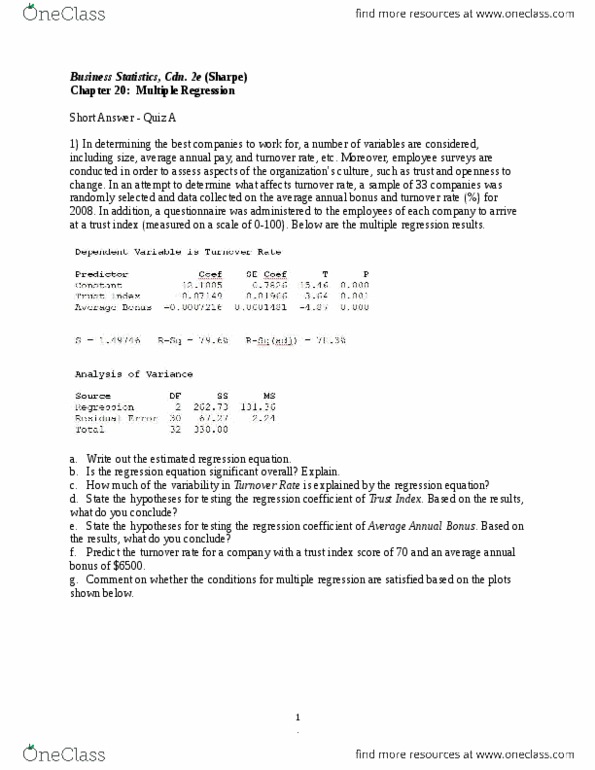
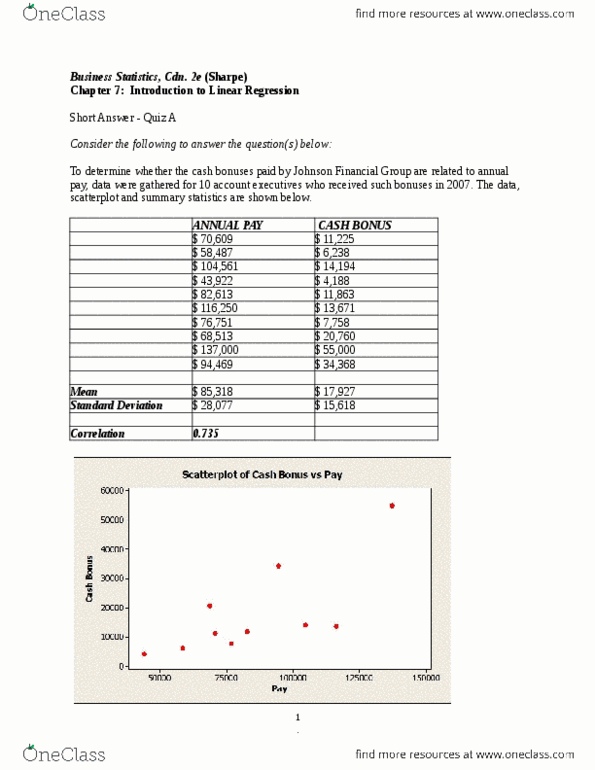
* independence assumption: these data were not collected over time and there is no reason to think that one salesperson"s performance affects another. * equal spread condition: neither the original scatterplot nor the residual plot shows any changes in the spread about the line. * nearly normal condition: the normal probability plot of residuals does not show severe departure from normality. H0: there is no association between gpa and sales performance. Ha: there is an association between gpa and sales performance. Answer: the test for regression slope results in t = 6. 80, p-value < 0. 0001. 0. 0001, we would reject the null hypothesis and conclude that there is strong evidence of an association between gpa and sales performance. Answer: the r2 for the regression is 78. 1%. Gpa seems to account for about three-fourths of the variation observed in sales performance (units sold per month). : 2: predict the units sold per month for a new hire whose college gpa is 3. 00.