ECON 1B03 Lecture Notes - Lecture 19: Economic Equilibrium, Demand Curve, Fixed Cost

3 Mar 2016
School
Department
Course
Professor


46
ECON 1B03 Full Course Notes
Verified Note
46 documents
Document Summary
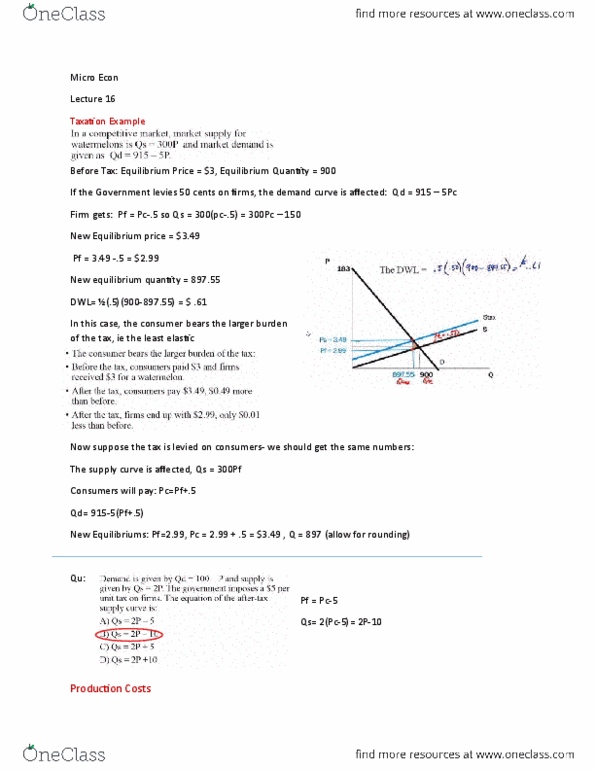
Pf = pc tax , ps = 3p. Tax = , so new supply equation ps = 3(pc-3) = 3pc 9. Using the equilibrium price and quantity, we can draw the x and y axis with these values to draw this graph, equilibrium at point a. Using the new equations and equilibriums, you can draw the after tax graph shifting the curves, equilibrium at point b. How much the firm will receive is pf = pc tax which is point c in this case the consumer pays more and firm receives less. Pc = 27. 25 and pf =24. 25 pc p = 27. 25-25 = 2. 25. P pf = 25 24. 25 = . 75. This means the firm is receiving . 75 less and the consumer is paying 2. 25 more, ie consumer bears larger burden of tax. Tax revenue is the rectangle between tax prices and quantity : Base x height = 72. 75 x (27. 25- 24. 25)