ENVIRSC 1A03 Lecture 4: Lab-Test-4.docx

26 Apr 2015
School
Department
Course
Professor
Document Summary
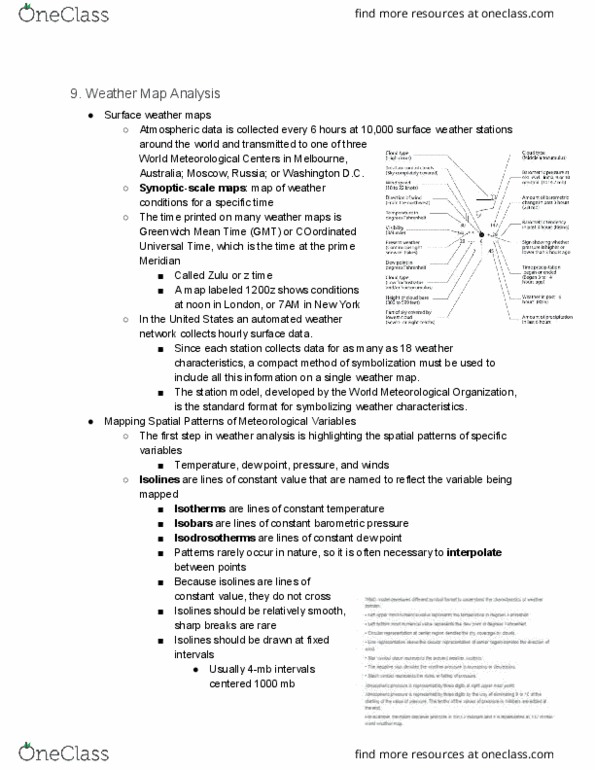
Isotherms are useful for weather forecasting because they can be used to identify temperature gradients and the position of weather fronts: weather maps contain a variety of numbers, symbols, and lines, which represent different meteorological information, the simple station model indicates how weather of each recording station is presented on the weather map, for mapping isotherms, we will only be concerned with the air temperature, ignore all other symbols. Slide 6: we also know that the temperatures at all of the other stations recorded on the map, before you draw your isotherms, you should first highlight the temperature at each recording station, on this map, we have highlighted the temperatures in yellow, once this is complete, using a colored pencil, start drawing your isotherms, for this example, we will be drawing isotherms for every 5 degrees celsius, for example, 5, 0, 5, 10, and so on.