SOCIOL 3H06 Lecture Notes - Lecture 8: Eye Color, Alcoholic Drink, Prenatal Diagnosis

10 Feb 2015
School
Department
Course
Professor
Document Summary
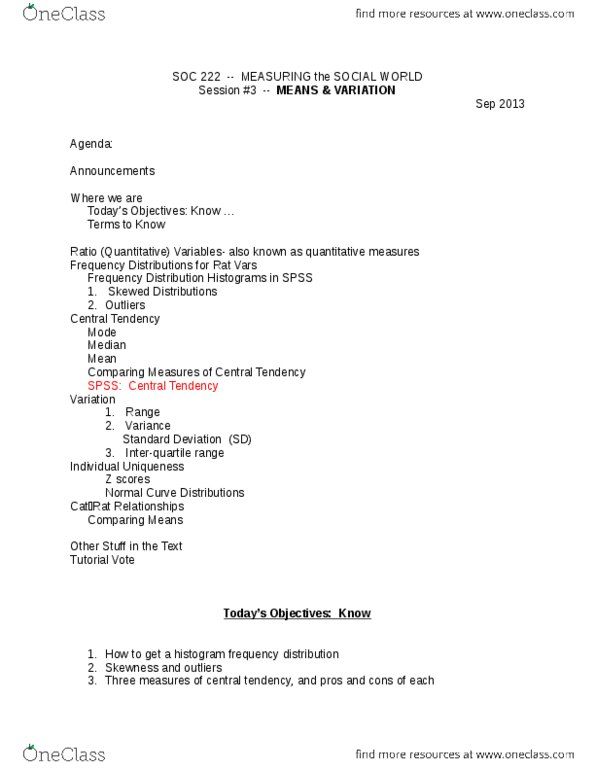
Last day"s class: review, frequencies: class intervals, translation tools, rates, ratio"s, and percentiles, graphical representation, course data and codebook, today"s tutorial, frequencies and graphs (lab 3) Today"s lecture: required reading: levin et al. 2 & 3: measures of central tendency, mean, median and mode, measures of dispersion, range, mean deviation, variance, standard deviation. Option 1: count the number of times each value occurs, the value with the highest count is the mode, graphically, the mode will be the biggest pie slice, bar, or highest point of a line. Bimodality: what if there are two frequently occurring numbers, in this situation we call the distribution bimodal , meaning, two modes . Interval/ratio data: arrange the cases in an array. From high to low (or low to high): locate the middle case. If n is odd, the median is the value for the middle case: 2, 4, 7, 8, 9, 10, 10.