SOCSCI 2J03 Lecture 5: SOCSCI 2J03 Lecture 5 – Organizing and Graphing Data

25 Jan 2019
School
Department
Course
Professor
SOCSCI 2J03 verified notes
5/27View all
Document Summary
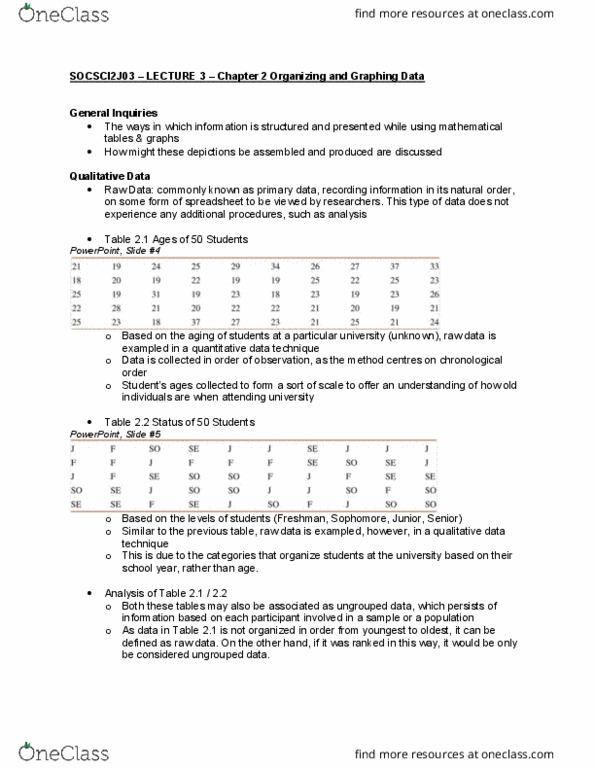
Socsci 2j03 lecture 5 organizing and graphing data. Used to denote the sum of values. X1 : subscription of x (1) denotes the number/ amount of the variable. : sum of all values (ex. x1 + x2) ( x) = sum (x1 + x2 = _) squared. X = sum of each value separately, then added (x1) + (x2) . X y = (x1) (y1) + (x2) (y2) N x (if n = 5) = n [ x1 + x2 + n3] 5 x = 5 [1 + 2 + 3] Data recorded in the sequence in which they are collected and before they are processed or ranked. Table 2. 1: ages of 50 students is quantitative raw data & ungrouped data & discrete because the ages are measured in years. Table 2. 2: status of 50 students is qualitative raw data & ungrouped data. An ungrouped data set contains information on each member of a sample or population individually.